FIGURE 1:
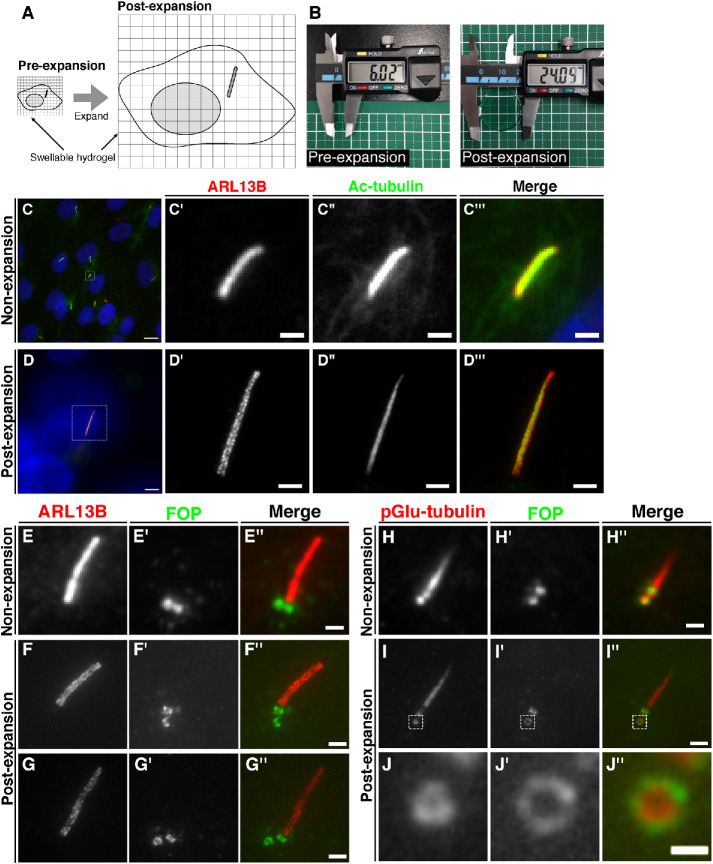
Comparison of cilia and centrioles in nonexpanded and expanded cells observed by conventional fluorescence microscopy. (A) Schematic diagram of the process of cell expansion. The immunostained cells are cross-linked to a polymer in a swellable hydrogel and treated with proteinase K. By immersing the gel in water, the cells physically expand about four times. (B) Comparison of the diameters of gel pieces before and after expansion. A circular piece of gel with a diameter of approximately 6 mm was expanded to approximately 24 mm. (C–J) RPE1 cells were serum-starved for 24 h to induce ciliogenesis, fixed, and immunostained with or without expansion. (C, D) Representative images of nonexpanded cells (C) and expanded cells (D) doubly immunostained for ARL13B and Ac-tubulin. Enlarged images of the boxed regions in C and D are shown in C′–C′′′ and D′–D′′′, respectively. Scale bars, 10 µm (C, D), 1 µm (C′–C′′′), and 4 µm (D′–D′′′). (E–G) Representative images of nonexpanded cells (E) and expanded cells (F and G) doubly immunostained for ARL13B and FOP. Scale bars, 1 µm (E) and 4 µm (F and G). (H–J) Representative images of nonexpanded cells (H) and expanded cells (I) doubly immunostained with an anti-FOP antibody and the GT335 antibody, which recognizes pGlu-tubulin. Enlarged images of the boxed regions in I–I′′ are shown in J–J′′. Scale bars, 1 µm (H), 4 µm (I), and 1 µm (J).

