FIGURE 4:
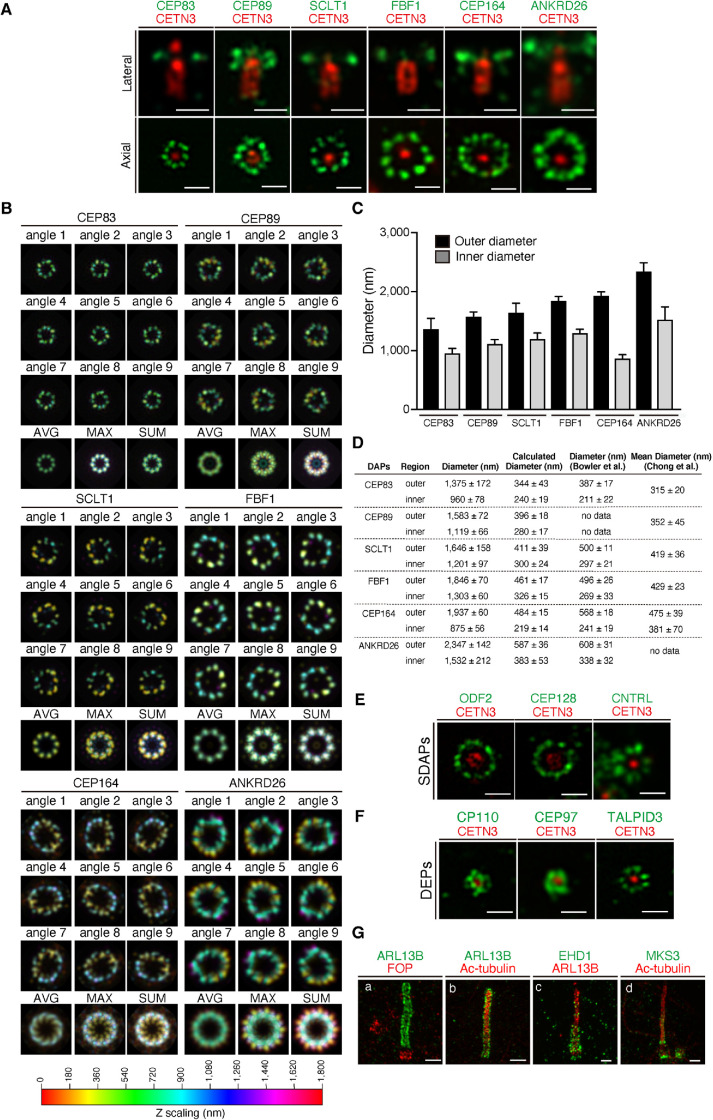
Airyscan analysis of the localization of centriolar and ciliary proteins in cells subjected to amplibody-proExM. (A) Fixed RPE1 cells were incubated with antibodies against CETN3 and the indicated DAP before amplibody-proExM treatment and analyzed by Airyscan microscopy. Images of laterally (top panels) or axially (bottom panels) oriented MCs are shown. Scale bars, 1 µm. (B) Maximum-intensity projections with color code in the Airyscan images were rotated nine times at 40° intervals around the CETN3 signal. The image set was then merged into one stack, and the average (AVG), maximum (MAX), and sum (SUM) projections were generated. The Z-scaling color coding is illustrated at the bottom. (C) Outer and inner diameters of rings positive for individual DAPs were measured and are expressed as bar graphs. Data are shown as means ± SD; n = 10. (D) Summary of the average outer and inner diameters of rings positive for individual DAPs determined in this study (C) and in the STORM study by Bowler et al. (2019) and Chong et al. (2020). Calculated diameters are shown as values divided by an expansion factor of 4. Diameters from Chong et al. represent mean diameters. (E, F) Fixed RPE1 cells were incubated with antibodies against CETN3 and the indicated SDAP (E) or DEP (F) before amplibody-proExM treatment, and analyzed by Airyscan microscopy. Scale bars, 1 µm. (G) RPE1 cells serum-starved for 24 h were fixed, incubated with antibodies against ARL13B (a, b, c), FOP (a), Ac-tubulin (b, d), EHD1 (c), and MKS3 (d) before amplibody-proExM treatment, and analyzed by Airyscan microscopy. Scale bars, 2 µm

