Figure 4.
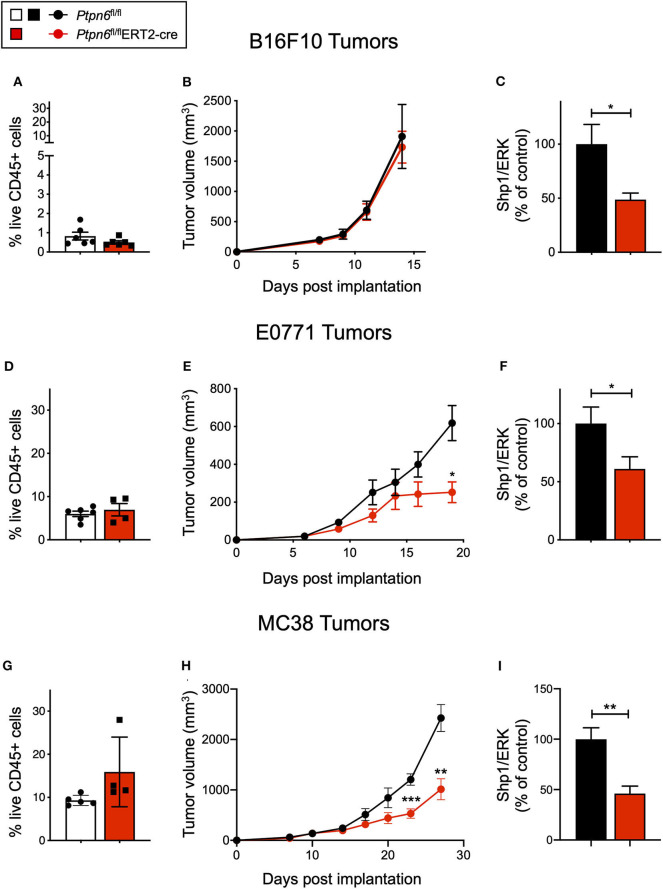
Ptpn6 deletion drives robust anti-tumor immunity in two immune-rich syngeneic tumor lines. (A) Flow cytometric analysis of live CD45+ cells from B16F10 melanoma tumors isolated from tamoxifen-treated Ptpn6fl/fl and Ptpn6fl/flERT2-cre mice at day 14 post tumor implantation. (B) B16F10 tumor volume measurements in tamoxifen-treated Ptpn6fl/flERT2-cre and Ptpn6fl/fl mice. Each data point represents the average tumor volume of all mice in a given group. Data is representative of three independent experiments with 5–7 mice/group. (C) Shp1 protein relative to total Erk2 protein in peripheral blood cells from indicated mice 14 days after initial tamoxifen dose (200 mg/kg bid for 4 days) and 7 days after B16F10 tumor cells were implanted. Data is representative of at least three independent experiments with 5–7 mice per group. (D) Flow cytometric analysis of live CD45+ cells from E0771 tumors isolated from tamoxifen-treated Ptpn6fl/fl and Ptpn6fl/flERT2-cre mice at day 19 post tumor implantation. (E) E0771 tumor volume measurements in tamoxifen-treated Ptpn6fl/flERT2-cre and Ptpn6fl/fl mice. Each data point represents the average tumor volume of all mice in a given group. Data is representative of three independent experiments with 4–5 mice per group. Statistical significance was calculated at each time point using an unpaired t-test. (F) Shp1 protein relative to total Erk2 protein in peripheral blood cells from indicated mice 14 days after initial tamoxifen dose (200 mg/kg bid for 4 days) and 7 days after E0771 tumor cells were implanted. Data is representative of at least three independent experiments with 4–5 mice per group. (G) Flow cytometric analysis of live CD45+ cells from MC38 tumors isolated from tamoxifen-treated Ptpn6fl/fl and Ptpn6fl/flERT2-cre mice at day 29 post tumor implantation. (H) MC38 tumor volume measurements in tamoxifen-treated Ptpn6fl/flERT2-cre and Ptpn6fl/fl mice. Each data point represents the average tumor volume of all mice in a given group (n = 10 Ptpn6fl/fl and n = 9 Ptpn6fl/flERT2cre, except for days 23 and 27 post tumor implantation, when data collected was from n = 9 Ptpn6fl/fl and n = 7 Ptpn6fl/flERT2-cre/group). Data are representative of two independent experiments with n = 9–10 or 4–5 mice per group. Statistical significance was calculated at each time point using an unpaired t-test. (I) Shp1 protein relative to total Erk2 protein in peripheral blood cells from indicated mice at day 13 post tumor implantation. Mice had been treated with tamoxifen (200 mg/kg bid for 4 days) prior to implantation with MC38 cells. Data is representative of two independent experiments with at least 4 mice/group. Error bars represent SEM, *p < 0.05, **p < 0.01, ***p < 0.001.

