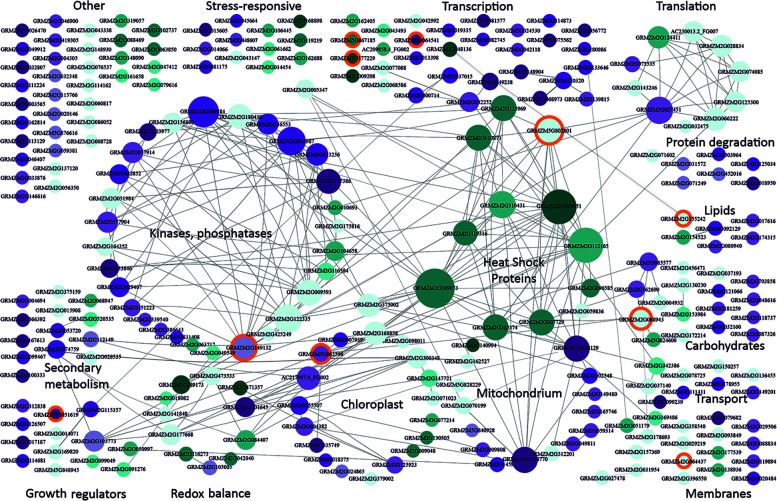
Figure 2.
Functional classification and interactions of maize genes responding to severe cold. csDEGs (Table S3; see text for definition) were assigned function basing on gene description and available characteristics (Gramene, MaizeGDB) and grouped manually into categories according to main function or organellar localization. Interactions between genes were found using Cytoscape v. 3.7.1. (Shannon et al., 2003). Genes are represented by circles with GRMZM numbers. The size of the circle is proportional to the number of gene partners (interactors), and interactions are indicated by lines aimed at the circle center. Cyan marks down-regulated genes, and magenta marks up-regulated ones. The intensity of colouring is proportional to the number of datasets reporting the gene as changing expression in severe cold. Light blue depicts genes showing inconsistent behavior in different studies [i.e., down-regulated in one or more study and up-regulated in another study(ies)]. Orange background marks genes changing also in response to moderate cold and listed in Supplementary Materials, Table S6. This figure is also available in an interactive format as Supplementary Figure S2.

