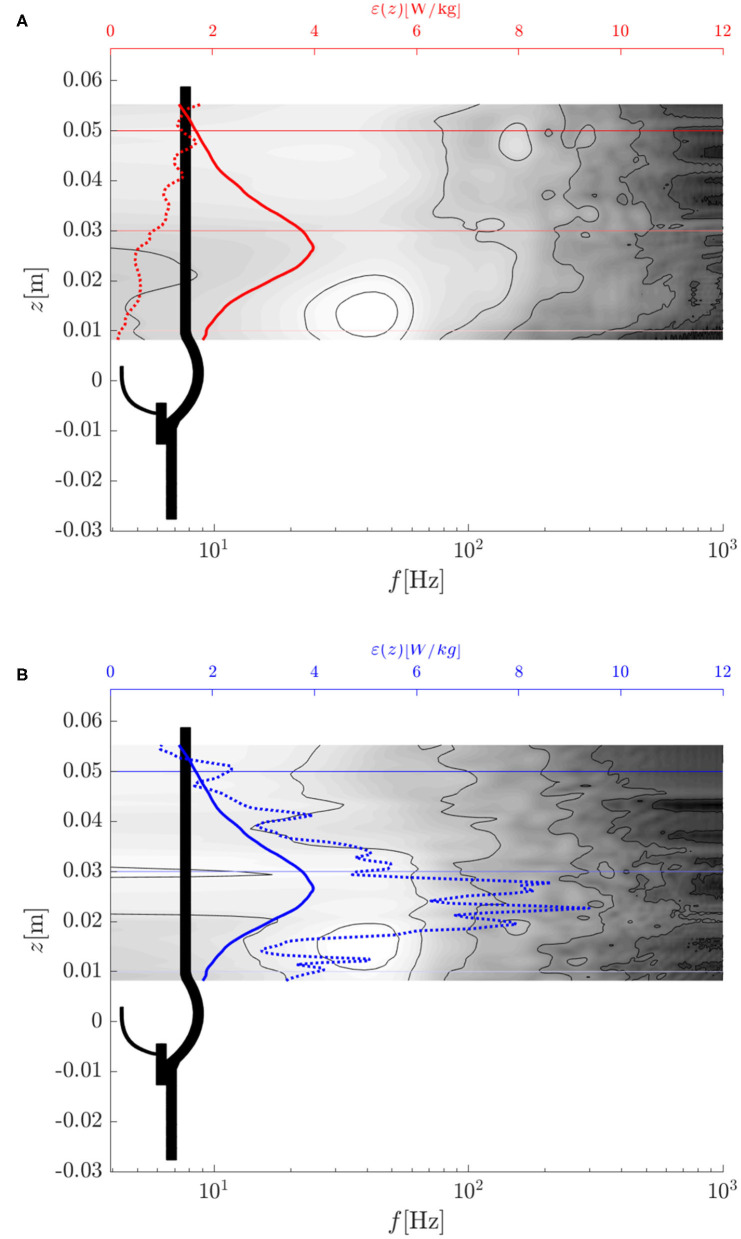
Figure 12.
Turbulent dissipation rate ϵ (dotted lines), average turbulent dissipation rate ϵavg (solid lines) and temporal power spectral density of (contour plot: white indicates high values, dark for low values): (A) along the center line (x0, y0, z) = (0, 0, z) m, (B) along a parallel line (x0, y0, z) = (−0.007, 0, z) m.

