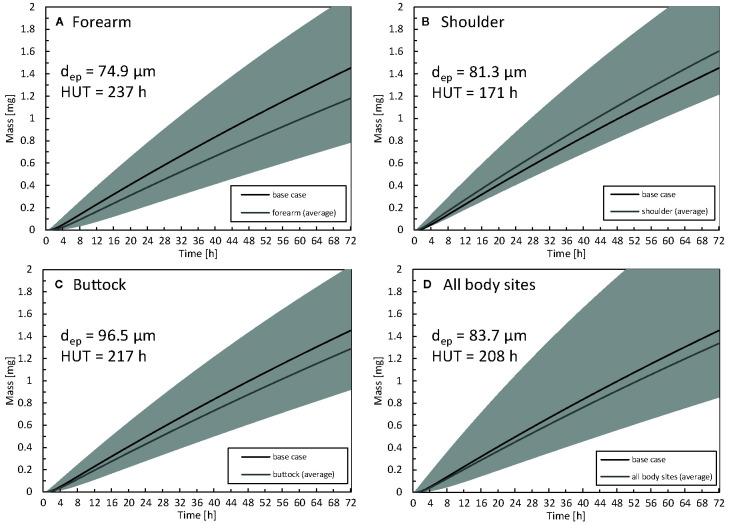
Figure 11.
Cumulative amount of drug taken up in the blood as a function of time for the forearm (A), shoulder (B), buttock (C) epidermal thickness averaged for all body sites (D). For comparison, the results of the base case are also depicted. The range corresponding to the simulated average thickness values +/- 2 x standard deviation (µi -/+ 2σi) is depicted in gray to quantify interpatient variability via the 2.5% and 97.5% quantiles. The thickness of the epidermis (dep) and half-uptake time (HUT) are indicated as well..

