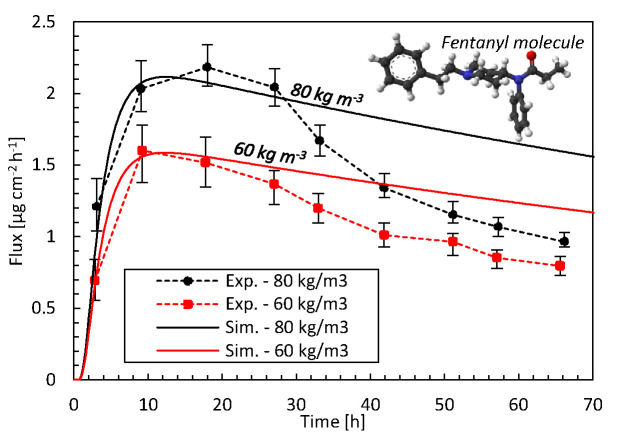
Figure 3.
Drug fluxes of fentanyl at surface 1 (gbl,up), so leaving the epidermis, from experiments (Exp.) and simulations (Sim.) for two initial patch concentrations (60 kg m-3, 80 kg m-3) as a function of time. The fentanyl molecule is illustrated as well, where the oxygen is depicted in red, carbon in black, hydrogen in white, and nitrogen in blue.

