Figure 7.

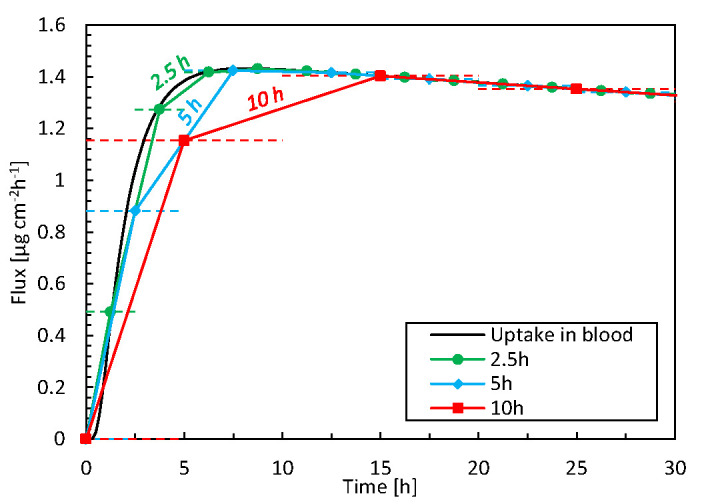
Flux taken up by the blood as a function of time for 3 time-averaging intervals, based on simulation data. The horizontal dashed lines indicate the time range over which the averaging took place, i.e., 2.5, 5, or 10 h.

Flux taken up by the blood as a function of time for 3 time-averaging intervals, based on simulation data. The horizontal dashed lines indicate the time range over which the averaging took place, i.e., 2.5, 5, or 10 h.