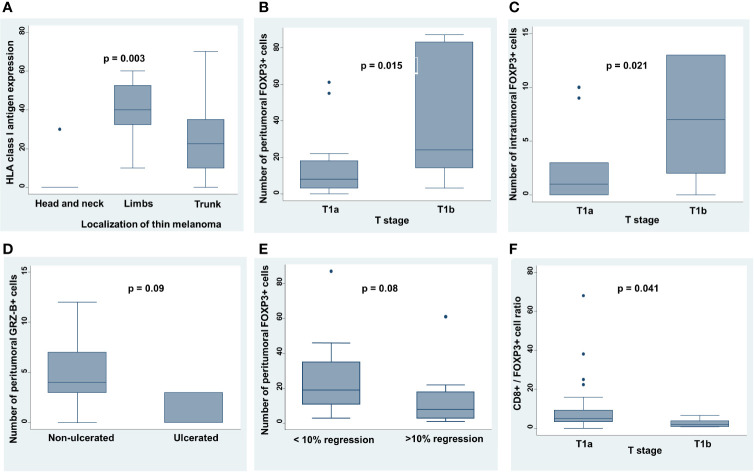
Figure 4.
Correlation between clinicopathological features and TIME characteristics in thin melanoma. (A) Site of primary thin melanoma was correlated to HLA class I antigen expression level by Kruskal-Wallis rank test. (B, C) T stage (sec. TNM, AJCC 8th Edition) was correlated to the number of peritumoral and intratumoral FOXP3+ T cells by Mann-Whitney U test. (D) Presence or absence of ulceration was correlated to the number of peritumoral GRZ-B+ T cells by Mann-Whitney U test. (E) Number of peritumoral FOXP3+ T cells was correlated with presence or absence of regression at 10% cut off of extension by Mann-Whitney U test. (F) T stage (sec. TNM, AJCC 8th Edition) was correlated to CD8+/FOXP3+ T cell ratio by Mann-Whitney U test. On each box, the central mark is the median, the edges of the box are the 25th and 75th percentiles, the whiskers extend to the most extreme data points note considered outliers, and outliers are plotted individually. p was considered significant if < 0.05.

