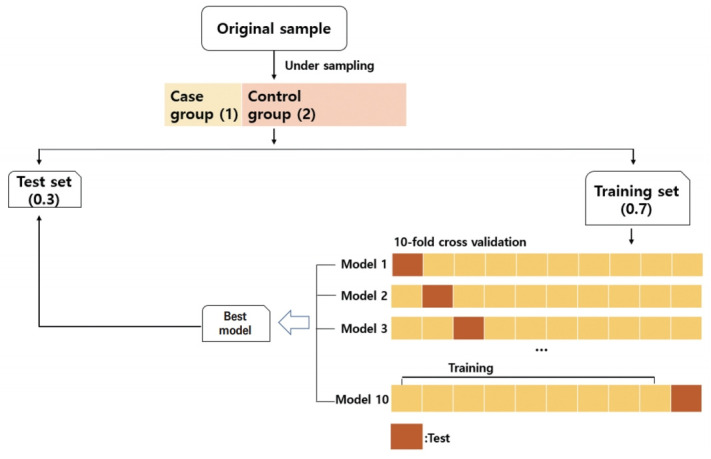
Fig. 1.

Schematic showing how the data were processed in this study. By choosing a random under-sampled selection of the control group at a 1:2 ratio, the presence of an imbalanced outcome variable was solved. The dataset was divided into two sets—0.7 for the training set and 0.3 for the test set. The training set went through ten-fold cross-validation. After learning the data of the training set using a random forest algorithm, the best model derived was evaluated in the test set. This process was repeated 1,000 times.
