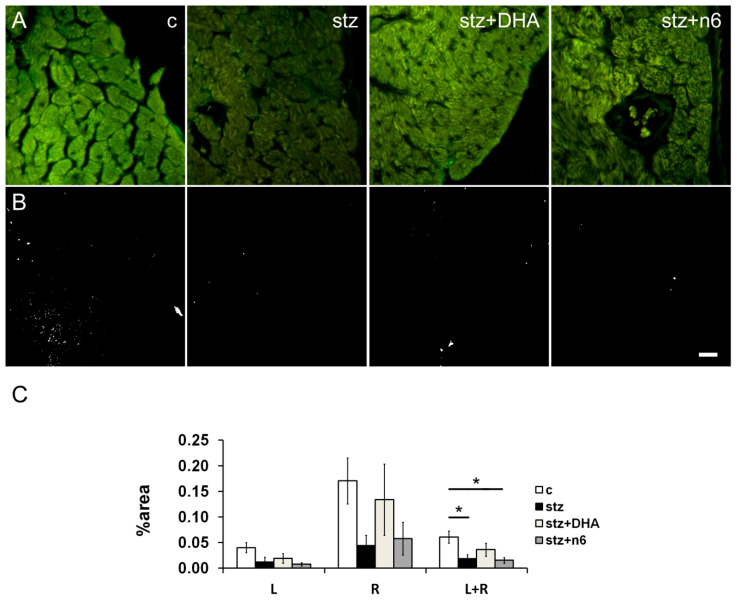
Figure 6.
Choline acetyl transferase immunoreactive nerve fiber density in subendocardial areas of cardiac septum. (A) Representative photomicrographs of right side of the subendocardial area of the cardiac septum stained for ChAT, a marker for parasympathetic fibers (green). c—Control group; stz—diabetic group fed standard diet (both diets n6/n3 ratio ≈7); stz+DHA—Diabetic group supplemented with n3 PUFA (2.5% of fish oil, containing 16% eicosapentaenoic acid—EPA and 19% docosahexaenoic acid—DHA; n6/n3 ratio of ≈1); stz+n6—diabetic group fed with diet that contained 2.5% sunflower oil (n6/n3 ratio ≈60). (B) Threshold figures from A; white—Nerve fiber area. (C)—Neuronal density expressed as percentage of the tissue area. *—p < 0.05 difference between indicated groups. Scale-bar = 20 µm.

