Figure 4.
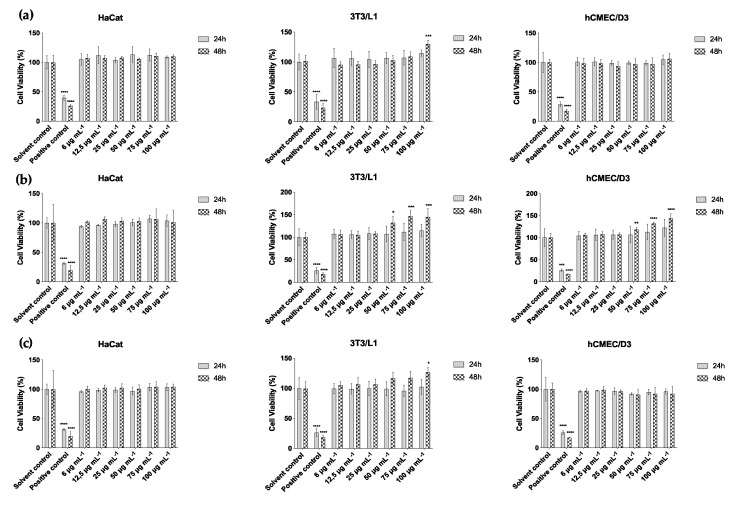
Cell viability after 24 and 48 h of exposure to cyanobacteria ethanol (70%) extracts of (a) Cyanobium sp. LEGE 07175, (b) Synechocystis salina LEGE 06155 and (c) Tychonema sp. LEGE 07196 in the cell lines HaCat, 3T3L1 and hCMEC/D3. Results are expressed as mean ± SD, n = 3. Statistical differences at * p < 0.05, ** p < 0.01, *** p < 0.001, **** p < 0.0001 (One way ANOVA).

