Figure 5.
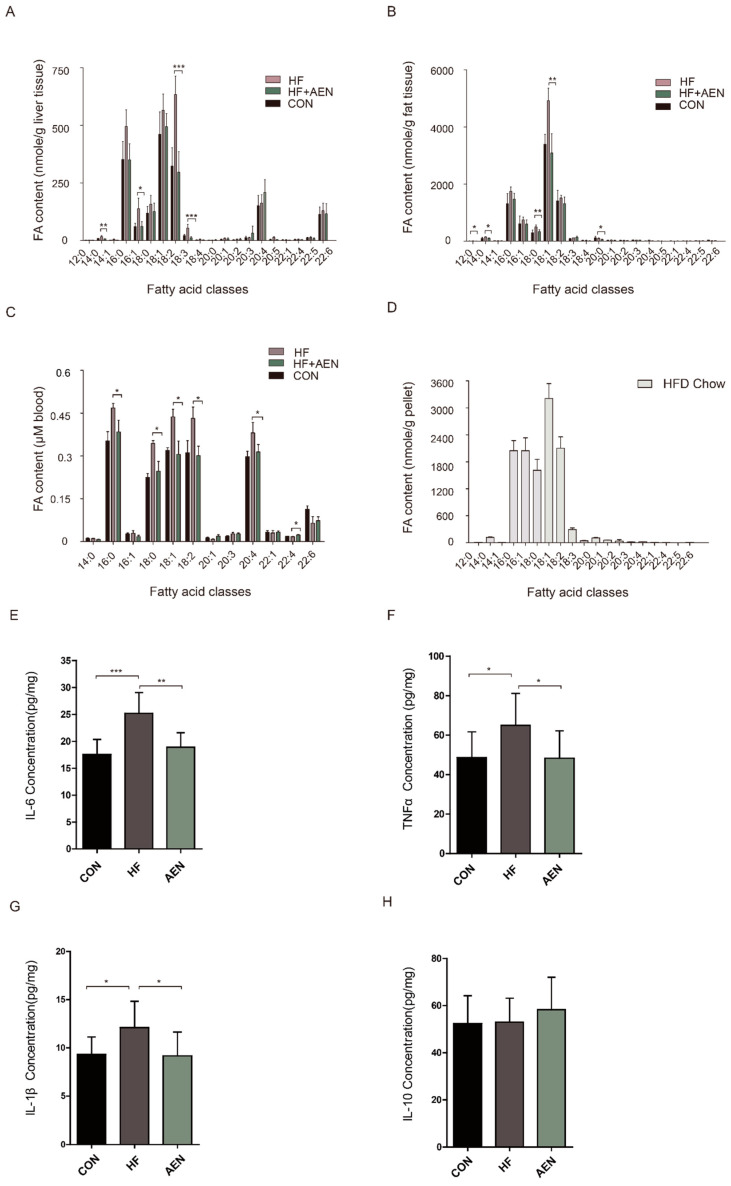
AEN regulated fatty acid species and contents and liver inflammation in NAFLD mice. FFA species and contents were quantified in (A) mouse liver, (B) white fat, and (C) blood samples of HF, HF + AEN, and conventionally raised (CON) mice. The FFAs were quantified in the HF pellets (D). AEN regulated cytokines TNF-α (E), IL-6 (F), IL-1β (G), and IL-10 (H) in mice liver. Data shown are averages of n = 8 mice. Error bars represent 1 SD. * p < 0.05, ** p < 0.01, *** p < 0.001.

