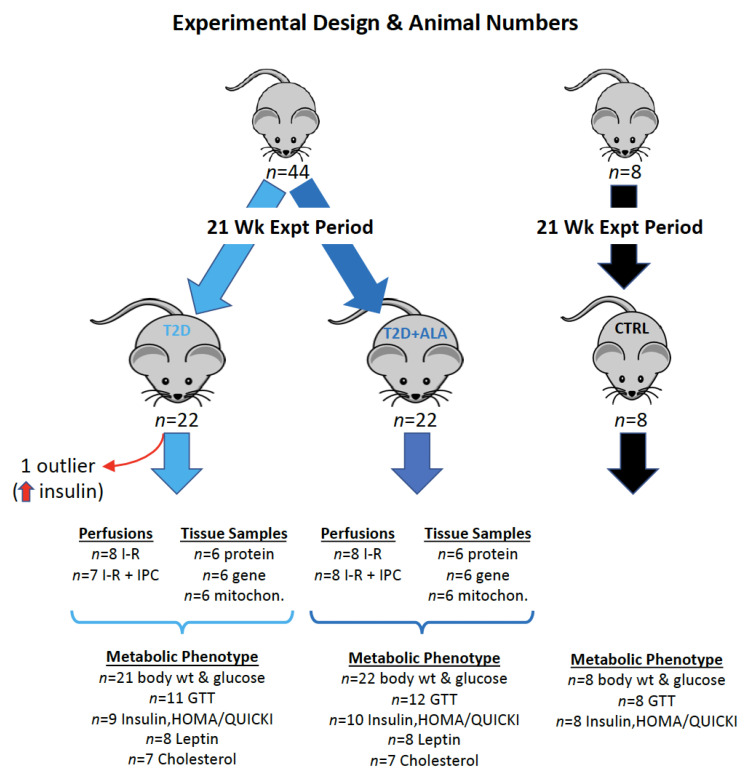
Figure A1.
The details of “n” values and the varied analytical procedures within each group of mice are shown. Age-matched control comparator mice (n = 8/group) were assessed to confirm a T2D phenotype in experimental groups, with body weight, GTT analysis, and determination of fasting glucose and insulin, and the HOMA-IR and QUICKI measures, undertaken in all 8 mice. A total of 44 mice were subjected to the T2D protocol, half receiving ALA in the final weeks (n = 22/group). One T2D mouse was identified as an outlier via Grubbs test (unusually high insulin), and subsequently removed, giving n = 21 for T2D and n = 22 for T2D + ALA. While body weights and fasting glucose were measured in all mice (n = 8 for control, n = 21 for T2D, n = 22 for T2D + ALA), metabolic assessment of the T2D and T2D + ALA groups was performed in randomly selected sub-sets of mice, as follows.

