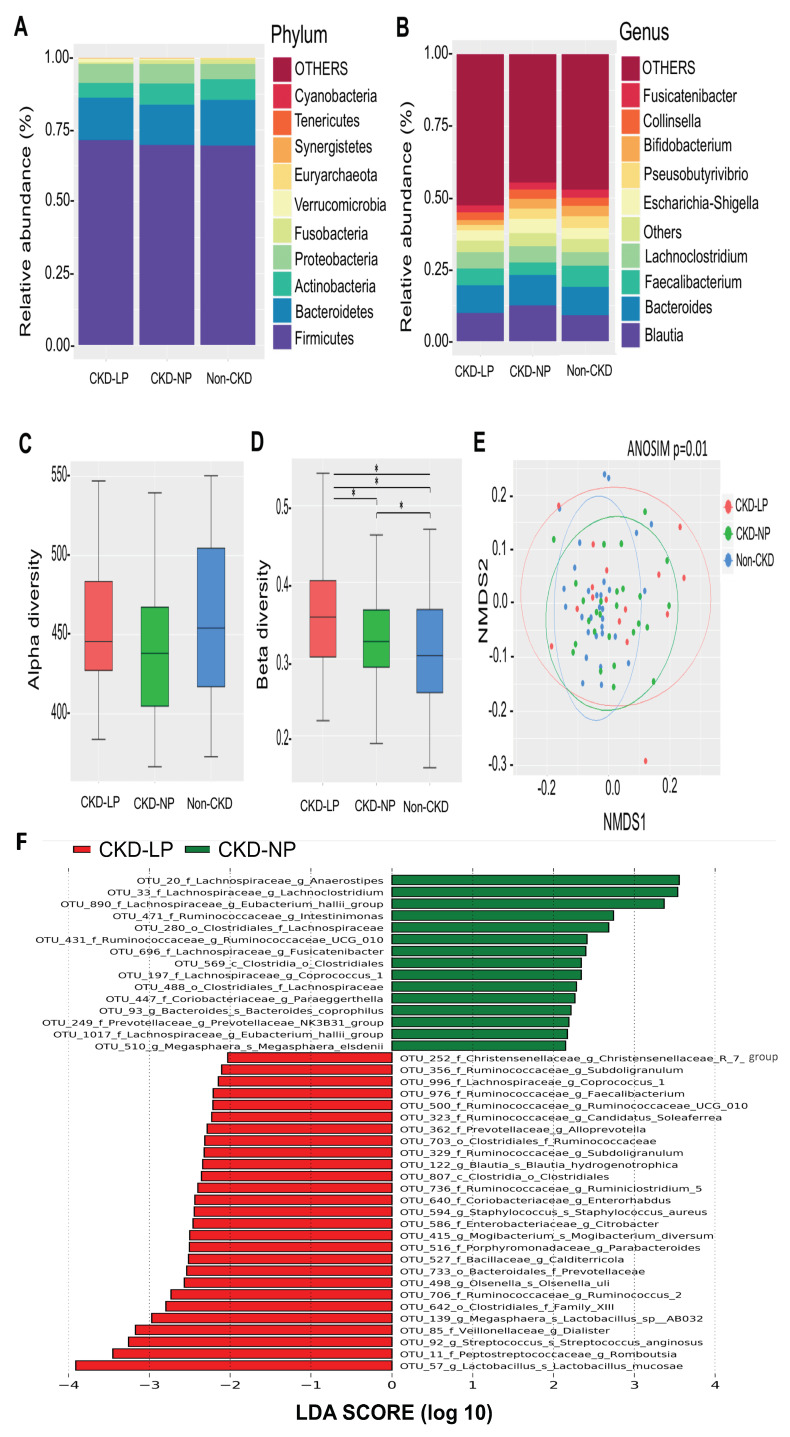
Figure 1.
Comparisons of gut microbiota composition and diversity in non-CKD controls and CKD patients receiving LPD or NPD. (A) The distribution of top 10 phyla and top 10 genera (B) detected among groups. (C) α- diversity (Chao 1) and (D) β-diversity (Bray–Curtis similarity index) of gut microbial communities among groups. The box-plot shows the median, the 25th, and the 75th percentile in each group. *, p < 0.001 (E) Nonmetric multidimensional scaling (NMDS) ordination based on weighted UniFrac parameters of intestinal microbial communities among groups. Significant sample-to-sample dissimilarities refer to analysis of similarity (ANOSIM, p = 0.01) test for discrimination in community composition among groups. (F) Bacterial taxa that best characterize each group were determine by applying linear discriminant analysis of effect size (LEfSe) on OTU tables. LP, low protein diet; NP, normal-protein diet.

