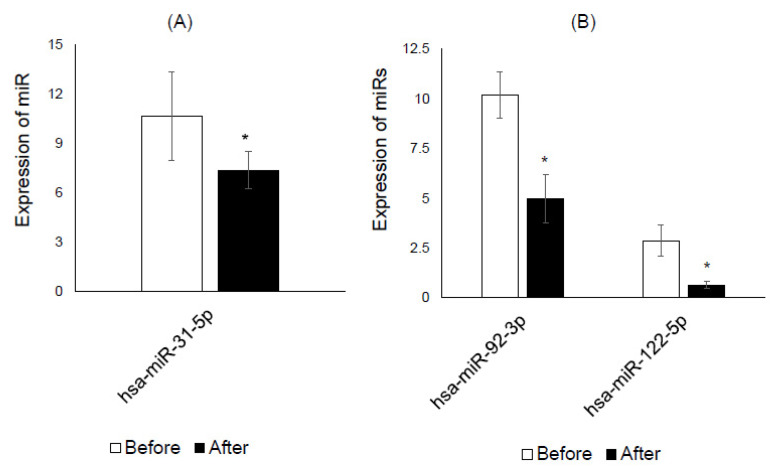
Figure 2.
Validation of saliva miRs by RT-qPCR. (A) Hsa-miR-31-5p was down-regulated in the saliva of the control diet group. (B) Hsa-miR-92-3p and hsa-miR-122-5p were down-regulated in the saliva of the K-diet group. White and black columns represent miR expression before and after the intervention, respectively. * p < 0.05 by paired t-test.

