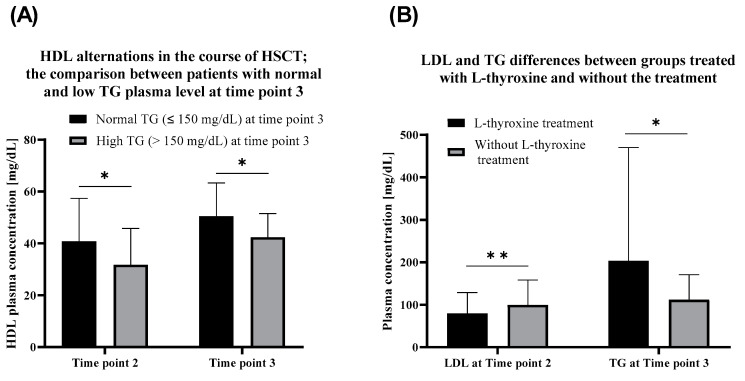
Figure 3.
(A) HDL alternations in the course of HSCT; the comparison between patients with normal and low triglycerides plasma level (TG) at time point 3. (B) LDL (low-density lipoproteins) and triglycerides differences between groups treated with L-thyroxine and the without treatment. *, p < 0.01, (U-Mann-Whitney test). **, p < 0.05, (U-Mann-Whitney test).

