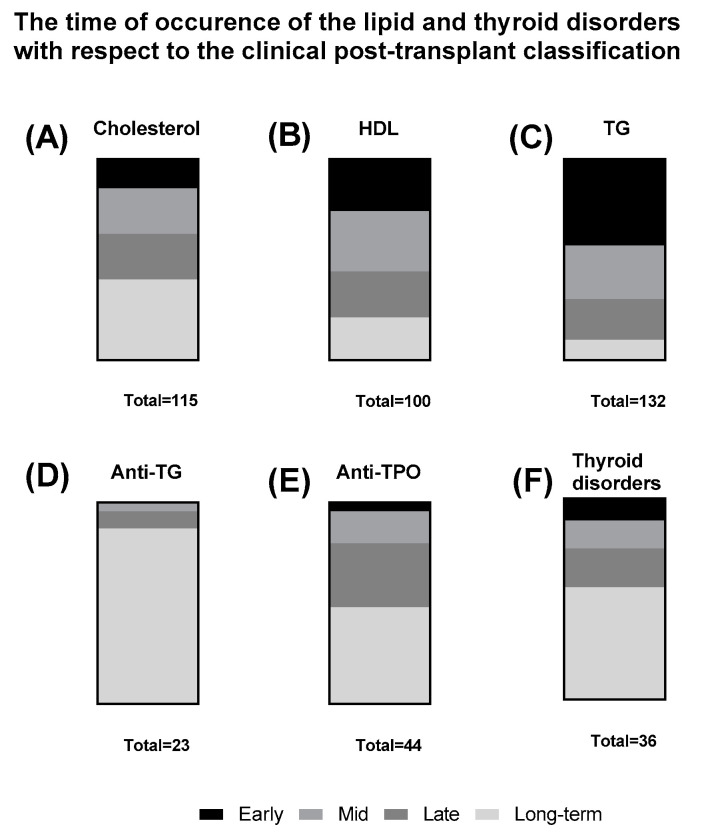
Figure 7.
The time of lipid and thyroid disorders occurrence with respect to the clinical post-transplant classification. The boxes represent the percentage of each class among patients that had the specific lipid disorder. (A) cholesterol disorder (n = 115); (B) HDL disorder (n = 100); (C) Triglycerides disorder (n = 132); (D) Anti-TG occurrence (n = 23); (E) Anti-TPO occurrence (n = 44); (F) Thyroid disorder (n = 36).

