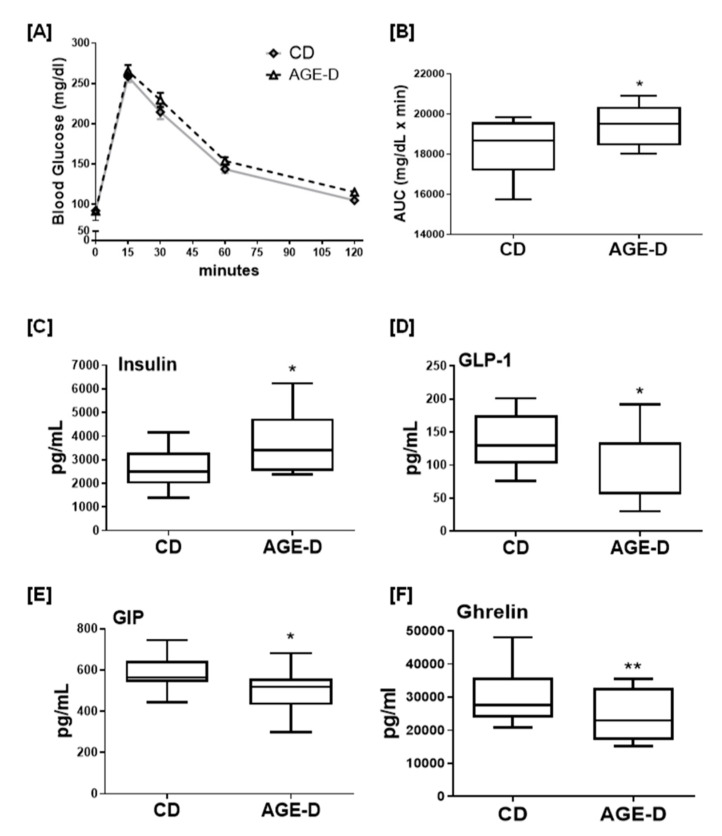
Figure 1.
(A) Oral glucose tolerance test (OGTT) performed after 22 weeks of dietary manipulation on control not-irradiated standard diet (CD) and advanced glycation end products-enriched diet (AGE-D) mice. (B) Area under the curve showing altered OGTT in AGE-D mice indicating glucose intolerance. (C–F) Plasma levels of insulin, GLP-1, GIP, and ghrelin in CD and AGE-D mice measured by luminex suspension bead-based multiplexed Bio-Plex 3D system. Data are means ± S.E.M. (n = 15 per group). Statistical significance: ** p < 0.01, * p < 0.05 vs. CD.

