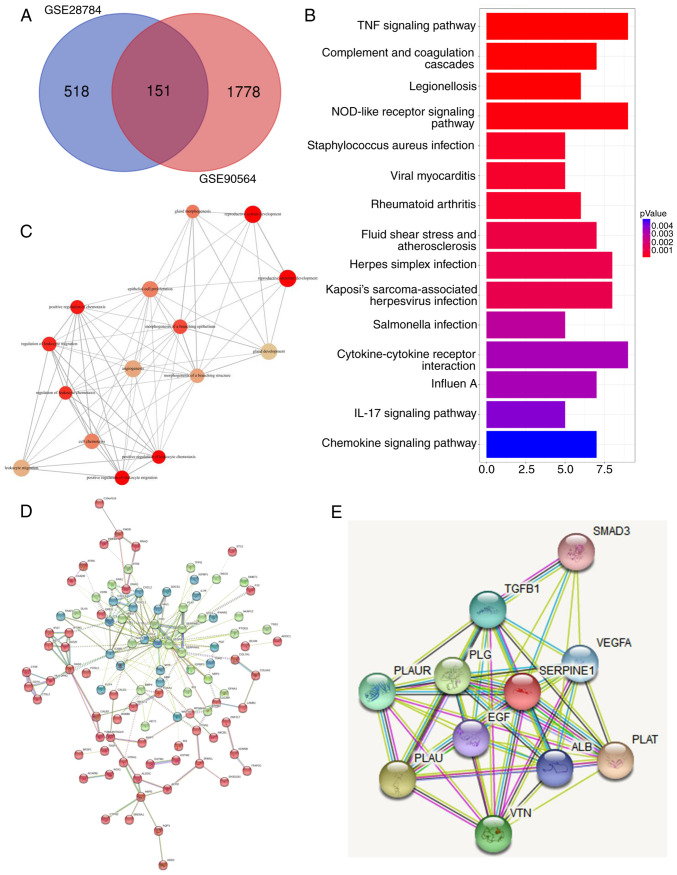
Figure 1.
Identification of signaling pathways and genes related to PTX resistance in breast cancer cell lines. (A) Venn diagram distribution of differentially expressed genes from 2 arrays. As revealed, 518 genes were specifically differentially expressed in GSE28784 cells and 1,778 genes were specifically differentially expressed in GSE90564 cells, while 151 genes were expressed in both datasets. (B) GO annotations and a functional pathway analysis of 151 genes performed using GO-terms and KEGG. (C) Gene-set enrichment analysis of common differentially regulated genes from A. (D) Gene interaction network constructed based on the shared gene list from A. Different colors represent different clusters as calculated using the K-means clustering method. Core genes in the network were identified based on their edge connectivity number. (E) Gene interaction map related to SERPINE1 generated using STRING. PTX, paclitaxel; GO, Gene Ontology; KEGG, Kyoto Encyclopedia of Genes and genomes; SERPINE1, serine protease inhibitor, clade E member 1; STRING, Search Tool for the Retrieval of Interacting Genes.

