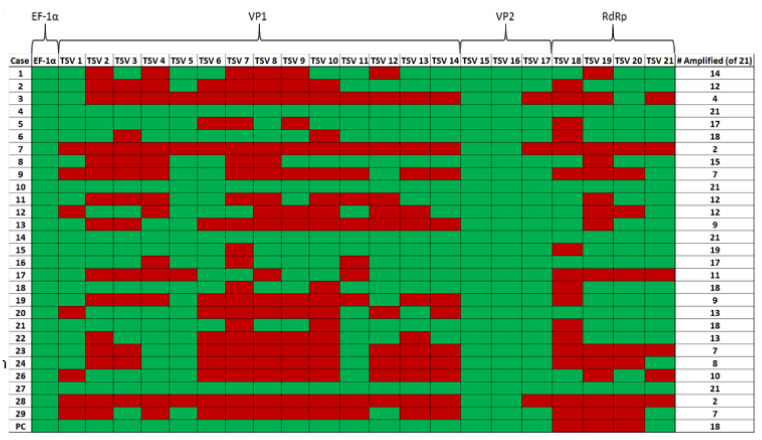
Figure 5.
A pictograph of the RT-PCR amplification of TSV capsid protein VP1 and VP2 genes, RNA-dependent RNA polymerase (RdRp) and shrimp internal control gene EF-1α. The primer pairs (TSV-1 to TSV-21) used to amplify different TSV genes are shown on the top row of the map. The case numbers are indicated in the far-left column (excluding Sample No. 25, as mentioned previously) and the total number of primer pairs (out of 21) that were successful in amplifying each sample can be seen in the far-right column. Green boxes indicate amplification and red boxes indicate no amplification for the corresponding primers.

