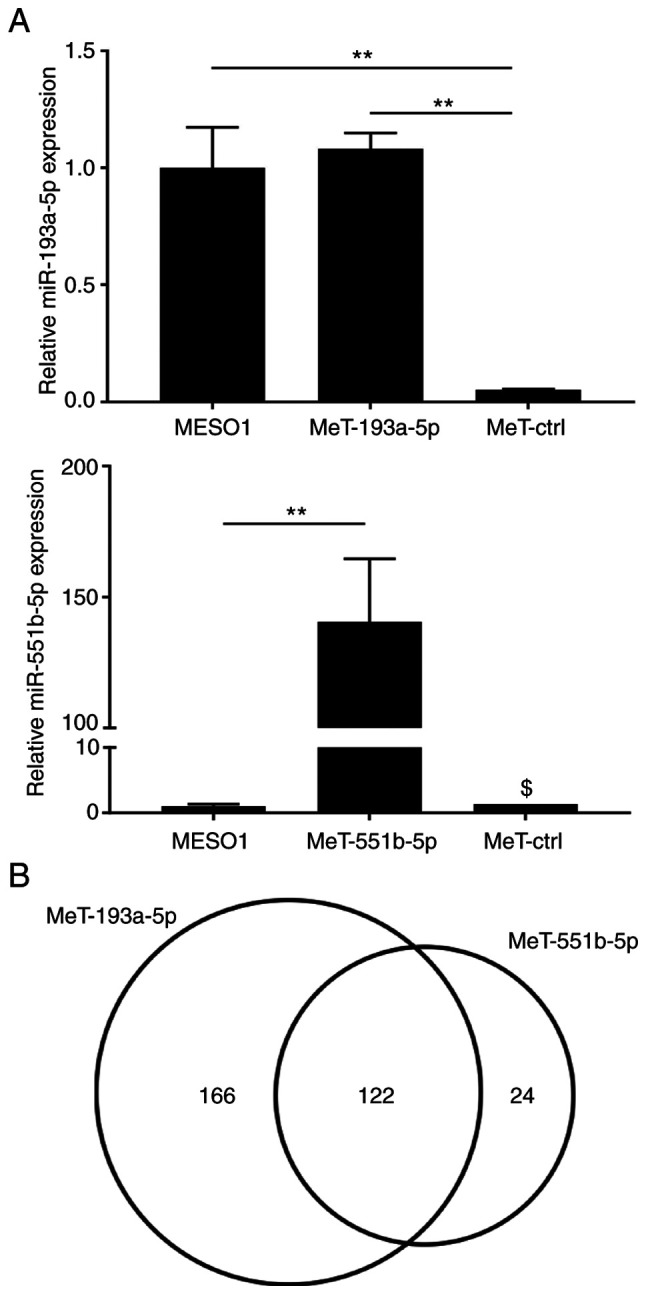
Figure 7.

Target gene analysis of hsa-miR-193a-5p and hsa-miR-551b-5p. (A) MeT-5A cells overexpressing hsa-miR-193a-5p (MeT-193a-5p) or hsa-miR-551b-5p (MeT-551b-5p) were established. Each intracellular expression level was measured by qPCR and corrected by U6 counts. The expression level of ACC-MESO1 cells were set to 1. The experiment was performed twice independently; bars, SD. **P<0.01. $Indicate that standard deviation could not be calculated because at least one value was below the detection limit. (B) Number of mRNAs commonly or specifically repressed in MeT-193a-5p and MeT-551b-5p cells, as shown in a Venn diagram.
