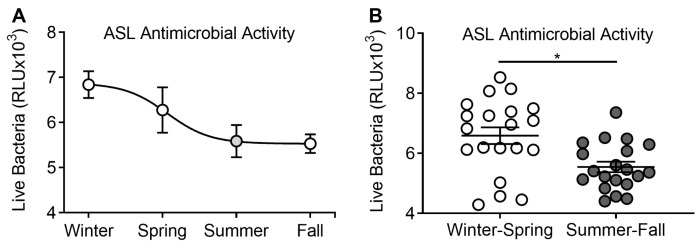
Figure 1.
Seasonal distribution of airway surface liquid (ASL) antimicrobial activity. (A) Live bacteria after challenge with ASL collected during all seasons in relative light units (RLUs). Each circle represents the mean RLU from all challenges with ASL collected during that season. Decreased RLU was interpreted as increased antimicrobial activity. (B) Live bacteria after challenge with ASL collected during winter–spring compared to summer–fall. Each circle corresponds to the result of the challenge with ASL from one participant. * p < 0.05.

