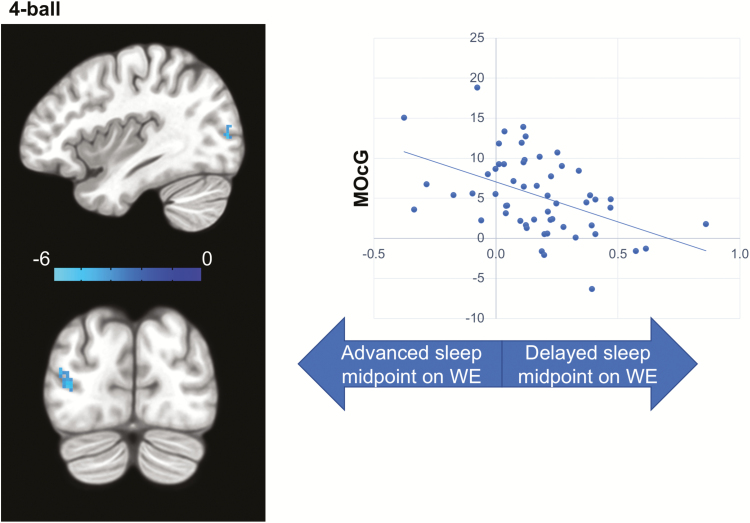
Figure 4.
Inconsistent sleep timing and VAT brain activation. Delayed sleep timing on WE was associated with lower activation of left MOcG in the 4-ball condition (left), while no associations were observed in the 2-ball or 3-ball conditions (z-map). The color bar shows the z-score. The plot on the right is only for the visualization of the direction of effect and not for the inference. The x-axis of the plot depicts inconsistent sleep timing calculated as WE–WD differences of sleep midpoint divided by an individual’s average sleep duration for all nights (see methods). The y-axis depicts t-score for VAT brain activation/deactivation during “TRACK” in contrast to “DO NOT TRACK” epochs.

