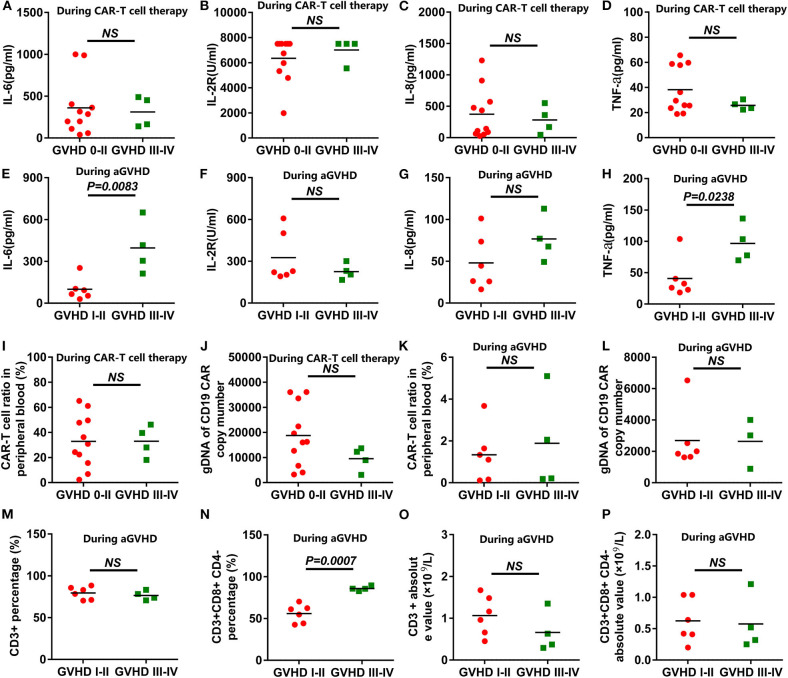
Figure 3.
Correlation analysis between the aGVHD and the cytokine levels or CAR-T cell levels. (A–D) The peaks of the cytokines in the anti-CD19-CAR T-cell therapy were uncorrelated with aGVHD levels. (E,H) The peaks of IL-6 and TNF-a in grade I-II in the aGVHD group were lower than those of the grade III-IV in the aGVHD group during the occurrence of aGVHD. (F,G) The peaks of the IL-2R and IL-8 during the occurrence of aGVHD were uncorrelated with aGVHD levels. (I–L) The peaks of anti-CD19-CAR T cells and anti-CD19-CAR gene were uncorrelated with aGVHD levels during the anti-CD19-CAR T-cell therapy and the occurrence of aGVHD. (N) The CD3+CD8+CD4- percentages in grade I-II in the aGVHD group were lower than that of the grade III-IV in the aGVHD group. (M,O,P) The CD3+ percentage, the CD3+ absolute value and the CD3+CD8+CD4- absolute value were uncorrelated with aGVHD levels during the occurrence of aGVHD.

