Figure 4.
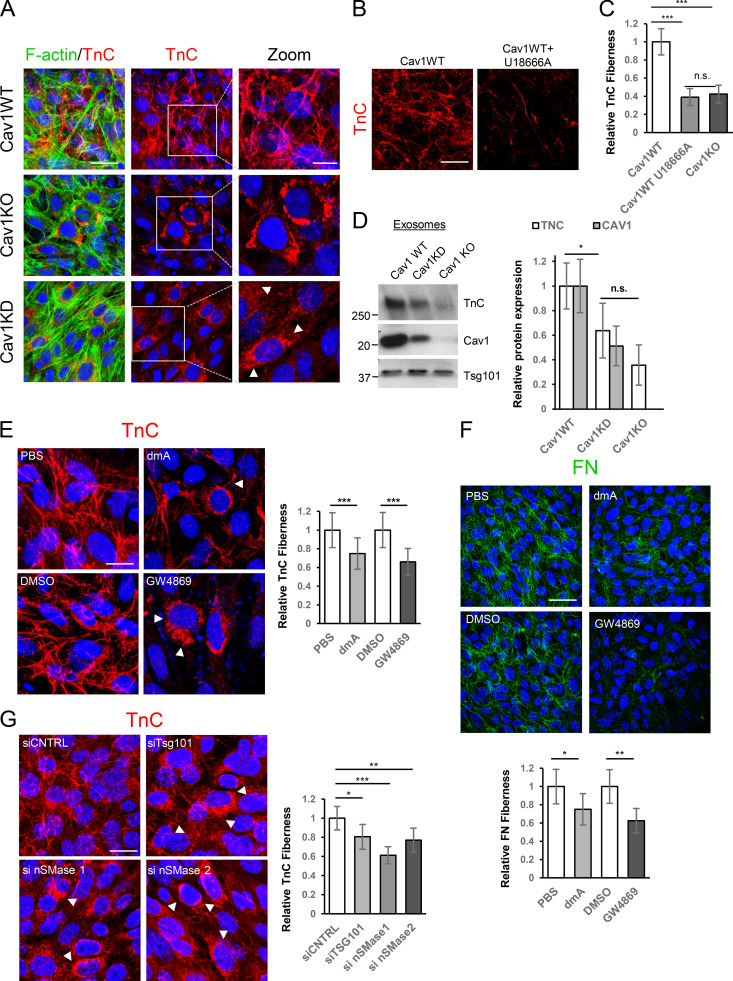
Exosome-mediated ECM deposition is a Cav1-dependent process. (A) Z-stack projection of confocal images showing TnC (red) in matrix deposited by WT, Cav1KD, and Cav1KO MEFs. F-actin is shown in green (scale bar, 40 µm). Zoomed views reveal an absence of TnC matrix deposition and a corresponding increased intracellular accumulation (white arrowheads) in Cav1KD and Cav1KO MEFs (scale bar, 10 µm). (B) TnC deposition of WT MEFs treated with U18666A determined by Z-stack projection confocal microscopy (scale bar, 40 µm). (C) Extracellular TnC deposition in fibers produced by Cav1WT, Cav1KO, and U18666A-treated Cav1WT MEFs (mean ± SD; n = 8). (D) Western blot analysis of TnC expression in exosomes secreted by indicated genotypes. Quantification: mean ± SEM; n = 6. (E) Effect of 5-d exposure to the exosome inhibitors dmA (75 nM) and GW4869 (10 µM) on TnC matrix deposition (red) by WT MEFs (scale bar, 20 µm). Right: chart shows extracellular TnC fiber deposition (mean ± SEM; n = 12). (F) Z-stack of confocal images showing the effect of 5-d exposure to dmA (75 nM) and GW4869 (10 µM) on FN matrix deposition (green) by WT MEFs (scale bar, 50 µm). Bottom: chart shows extracellular FN fiber deposition (mean ± SEM; n = 5). (G) Representative Z-stack projection of confocal images showing the effect of siRNAs targeting Tsg101 and neutral nSMase1 and 2 on TnC matrix deposition by WT MEFs (red; scale bar, 20 µm). The chart to the right shows extracellular TnC deposition in fibers measured as in C (mean ± SEM; n = 6). n.s., not significant. For all graphs, *, P < 0.05; **, P < 0.01; ***, P < 0.001.

