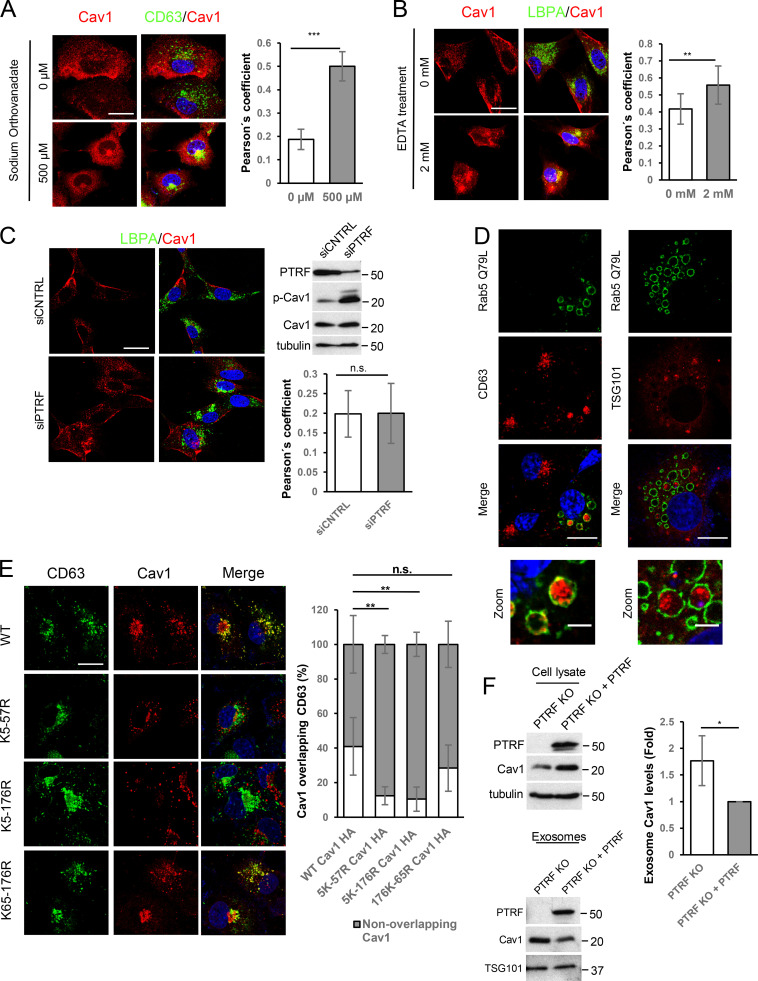
Figure S1.
Internalization of Cav1 favors its entry into exosomes. (A) Colocalization analysis of Cav1 (red) and CD63 (green) in WT MEFs after 2-h treatment with sodium orthovanadate (scale bar, 25 µm). Chart shows colocalization between CD63 and Cav1 as measured by Pearson’s correlation coefficient (mean ± SD; n = 2, total 80 cells). (B) Colocalization analysis of Cav1 (red) and LBPA (green) after 10-min EDTA treatment (scale bar, 25 µm). Chart shows Pearson’s correlation coefficient of the colocalization between the two labels (mean ± SD; n = 2, total 80 cells). (C) Confocal microscopy of Cav1 (red) and LBPA (green) in PTRF-KD MEFs (scale bar, 25 µm). A representative Western blot of phosphorylated Cav1 is shown for PTRF-KD cells. Chart shows colocalization analysis as measured by Pearson’s correlation coefficient (mean ± SD; n = 2, total 40 cells). (D) Confocal analysis of COS7 cells transfected with Rab5(Q79L) (green) and the exosomal markers CD63 and Tsg101 (red; scale bar, 15 µm). Zoomed views show the intraluminal accumulation of both markers (scale bar, 5 µm). (E) Colocalization analysis of lysine-arginine Cav1 mutants (red) and CD63 (green; scale bar, 25 µm). Chart shows the percentage of labeled colocalization (mean ± SD; n = 3). (F) Western blot analysis of Cav1 in cell lysates and released exosomes of control and PTRF-reconstituted PTRFKO cells. Tubulin and Tsg101 were used as loading controls. Chart shows Cav1 levels in exosomes produced by either control or PTRF-reconstituted PTRFKO cells (mean ± SD; n = 4). CNTRL, control; n.s., not significant. For all graphs, *, P < 0.05; **, P < 0.01; ***, P < 0.001.

