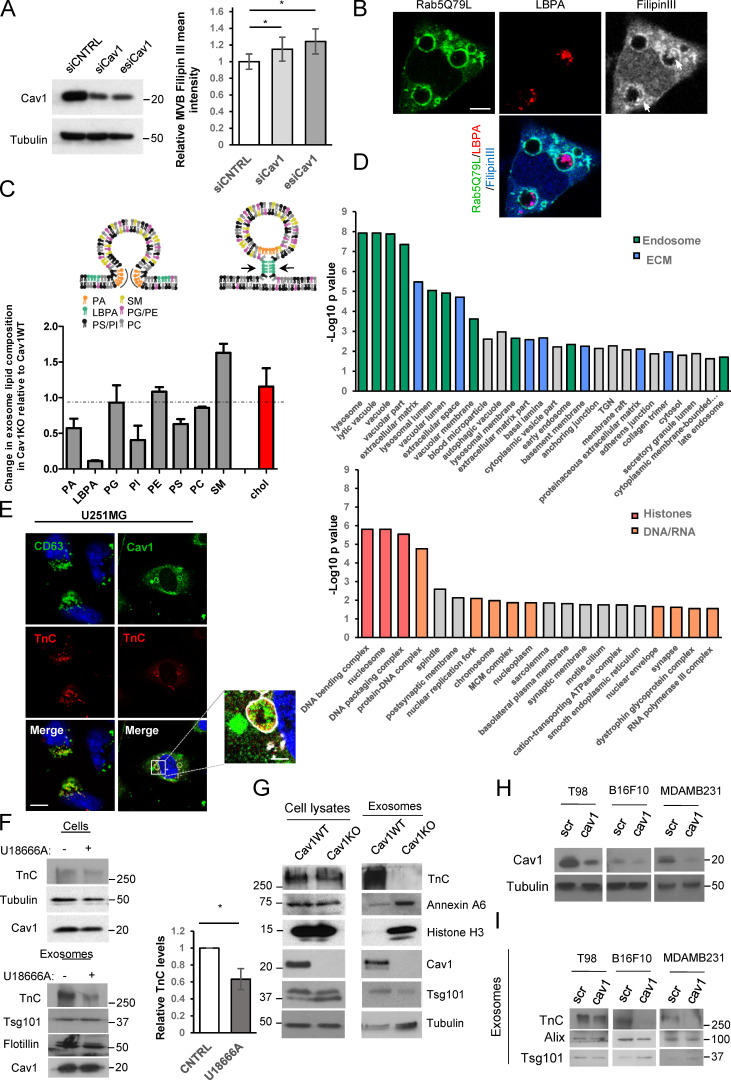
Figure S2.
Cav1-positive exosomes display a specific lipid/protein composition. (A) Western blot confirming Cav1KD in WT MEFs. Chart shows filipin III mean fluorescence intensity at MVBs of WT MEFs transfected with either control (siCNTRL, silencing RNA duplex control) or Cav1-targeting siRNAs (siCav1, siRNA duplex targeting Cav1; esiCav1, enzymatically prepared siRNAs targeting Cav1; mean ± SD; n = 4). (B) Distribution of LBPA (red) and filipin III (grey and blue) in Rab5(Q79L)-expressing MEFs (green). Arrows indicate LBPA and filipin III colocalization at ILVs (scale bar, 5 µm). (C) Upper panel: lipids involved in exosome biogenesis are summarized in the scheme (adapted from Subra et al., 2007). Lower panel: MS analysis of lipid composition profiles of Cav1KO MEF-derived exosomes compared with WT-derived exosomes. Values denote relative content in Cav1KO-derived exosomes as normalized to the relative content measured in WT exosomes for each lipid class (mean ± SD; n = 2 for determination of all lipid species except for cholesterol; for cholesterol determination, n = 3). PA, phosphatidic acid; SM, sphingomyelin; PG, phosphatidylglycerol; PI, phosphatidylinositol; PC, phosphatidylcholine; PE, phosphatidylethanolamine. (D) Enrichr diagram of “cellular component” category for proteins upregulated in either WT MEF–derived exosomes (top) or Cav1KO MEF–derived exosomes (bottom). MCM complex, minichromosome maintenance protein complex. (E) Colocalization analysis of TnC (red) with CD63 or Cav1 (green) in U251 glioblastoma cells expressing Rab5(Q79L) (white; scale bar, 25 µm; zoomed view scale bar, 2.5 µm). (F) Western blot analysis of TnC in cell lysates and released exosomes of untreated or U18666A-treated WT MEFs. Tsg101 was used as exosome loading control. Chart shows the relative amount of TnC in exosomes produced by WT control and U18666A-treated cells (mean ± SD; n = 4). (G) Western blot analysis confirming protein expression changes identified by quantitative proteomics in WT fibroblast lysates and purified exosomes compared with Cav1KO counterparts. (H) Validation of lentivirus-mediated KD (scr, scrambled control sequence; Cav1, Cav1-targeting shRNA) of Cav1 mRNA across tumor cell lines (T98: glioblastoma; B16F10: melanoma; MDAMB231: breast cancer). (I) Western blot analysis of TnC secretion in exosomes produced by the different tumor cell lines described in H. Tsg101 and Alix were used as exosomal markers. CNTRL, control. For all graphs, *, P < 0.05; **, P < 0.01; ***, P < 0.001.

