Figure 6.
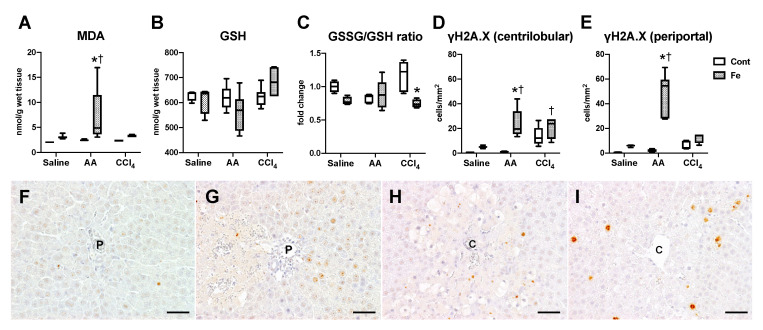
Hepatic content of malondialdehyde (MDA); (A), glutathione (GSH); (B) and the ratio of glutathione disulfide (GSSG) to GSH (C). The number of γH2A.X-positive hepatocytes in the centrilobular (D) and periportal region (E) of the liver. * p < 0.05 vs. control diet group with same chemical administration (diet factor), † p < 0.05 vs. saline group with same diet feeding (chemical factor), by Sidak’s multiple comparison. Representative images of immunohistochemistry for γH2A.X in the liver of Cont-AA (F), Fe-AA (G), Cont-CCl4 (H), and Fe-CCl4 (I) groups. The number of γH2A.X-positive periportal (Zone 1) hepatocytes is higher in the Fe-AA than in Cont-AA group, while the number of γH2A.X-positive centrilobular (Zone 3) hepatocytes does not differ significantly between Cont-CCl4 and Fe-CCl4 groups. P, portal vein; C, central vein. Bar = 50 μm.

