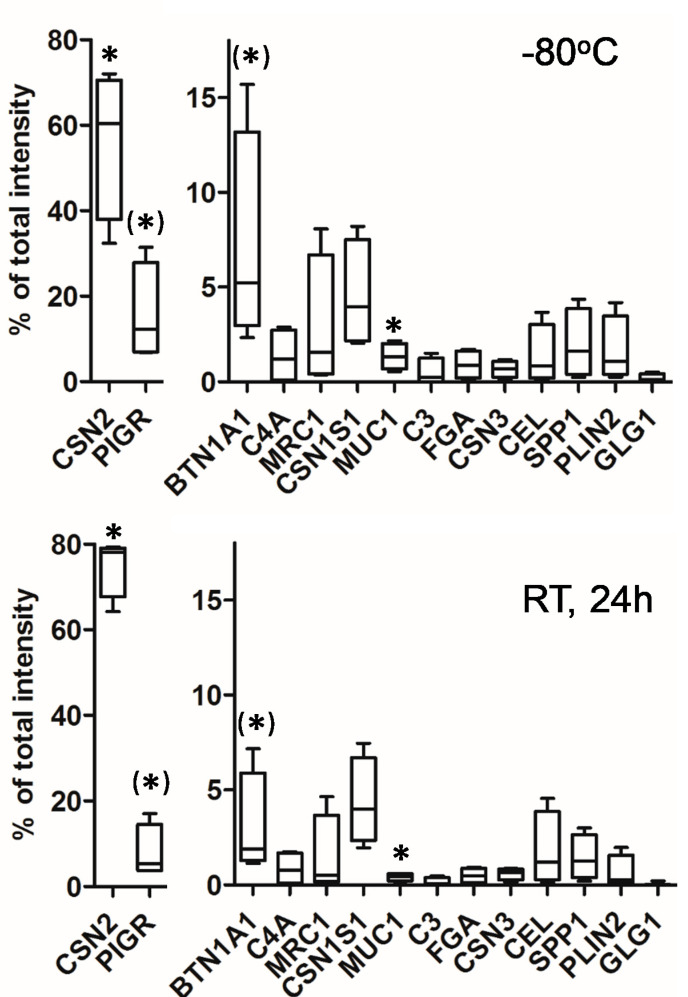
Figure 3.
Percentage of the total intensity of 14 proteins representing the 10 most abundant proteins per sample. Boxes display the variation across the milk samples of four different mothers immediately frozen at −80 °C or stored for 24 h at RT. Difference in abundance after storage in the two different conditions was calculated by paired t-test. Lines indicate median values. Whiskers are set to minimum and maximum values. * p < 0.05; (*) PIGR p = 0.06; BTN1A1 p = 0.08. CSN2, beta-casein; PIGR, polymeric immunoglobulin receptor; BTN1A1, butyrophilin subfamily 1 member A1; CSN1S1, alpha S1-casein; MRC1, macrophage mannose receptor 1; SPP1, osteopontin; PLIN2, perilipin 2; MUC1, mucin 1; CEL, bile salt-activated lipase; C4A, complement C4-A; FGA, fibrinogen alpha chain; CSN3, kappa-casein; C3, complement C3; GLG1, Golgi apparatus protein 1.

