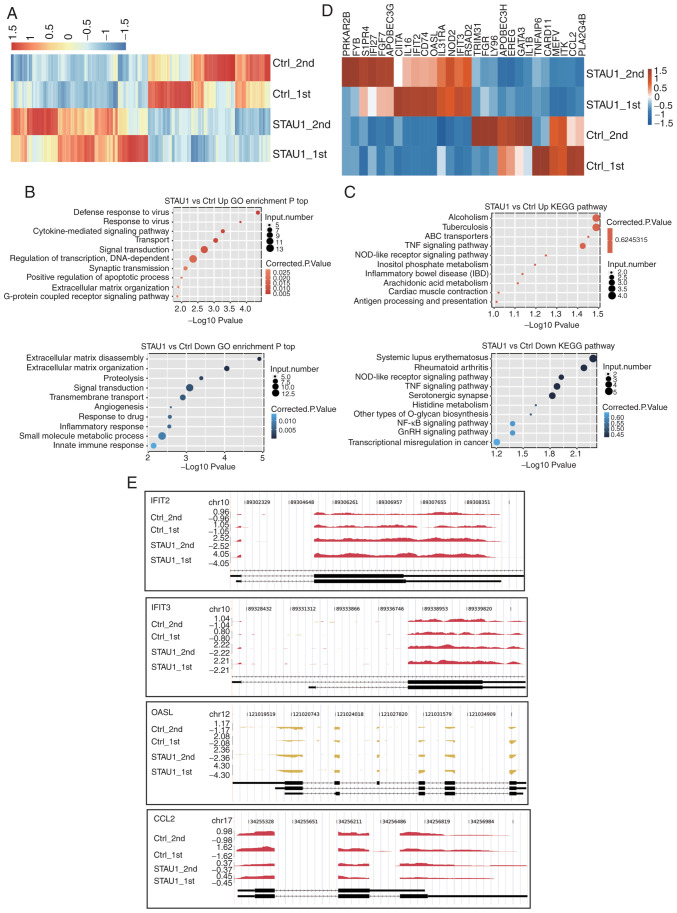
Figure 2.
RNA-seq analysis of STAU1-regulated transcriptome. (A) Hierarchical clustering of DEGs in the control and STAU1-overexpression samples. FPKM values were log2-transformed and then median-centered by each gene. (B) The top 10 representative GO biological processes of upregulated and downregulated genes. (C) The top 10 representative KEGG pathways of upregulated and downregulated genes. (D) Hierarchical clustering of DEGs enriched in cytokine-mediated signaling, inflammatory response, and immune response. (E) Reads coverage and distribution across representative DEGs involved in cytokine-mediated signaling and immune response. RNA-seq, RNA sequencing; STAU1, double-stranded RNA-binding protein Staufen homolog 1; DEGs, differentially expressed genes; FPKM, fragments per kilobase of transcript per million fragments mapped; Kyoto Encyclopedia of Genes and Genomes; GO, Gene Ontology.

