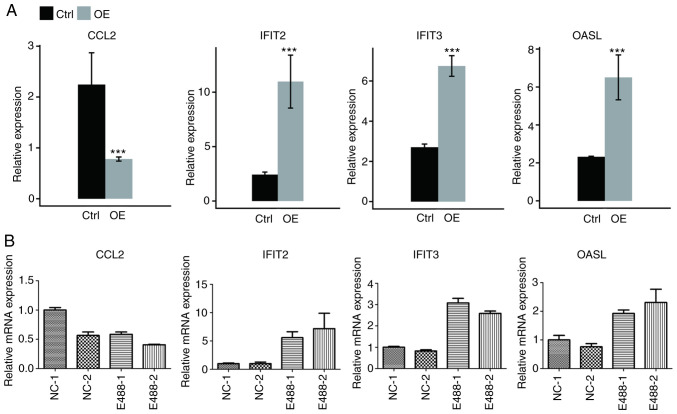
Figure 3.
Validation of the expression level of DEGs enriched in cytokine-mediated signaling and immune response. Gene expression quantified by (A) RNA seq data and (B) RT-qPCR. Error bars represent mean ± SEM. ***P<0.001. FPKM values were calculated as described in the Materials and methods. DEGs, differentially expressed genes; RNA seq, RNA sequencing; RT-qPCR, reverse transcription-quantitative PCR; FPKM, fragments per kilobase of transcript per million fragments mapped; CCL2, chemokine (C-C motif) ligand 2; IFIT2, interferon-induced protein with tetratricopeptide repeats 2; IFIT3, interferon-induced protein with tetratricopeptide repeats 3; OASL, 2′-5′-oligoadenylate synthetase-like protein; Ctrl, control; OE, overexpression.

