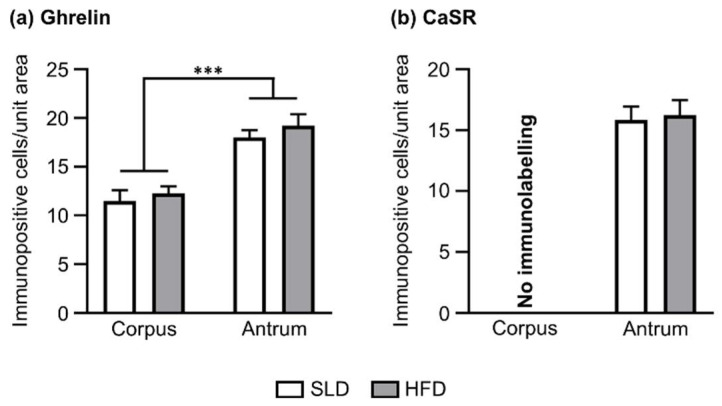
Figure 3.
Density of ghrelin and CaSR immunopositive cells in the glandular base of gastric corpus and antrum of mice fed standard laboratory diet (SLD, n = 5) or high-fat diet (HFD, n = 5) for 12 weeks. (a) Cell counts showed a higher density of ghrelin cells in the glandular base of the gastric antrum than corpus. A comparable number of ghrelin cells was observed in the corpus of SLD and HFD mice. Similarly, comparable numbers of ghrelin cells were found in the antrum of SLD and HFD mice. (b) CaSR cells were located in the antrum only, with no immunolabelling observed in the corpus. A comparable number of CaSR cells were observed in the antrum of SLD and HFD mice. Cell counts are the mean value of 5–6 non-adjacent tissue sections per mouse and gastric region (unit area = 159 × 159 µm). Two-way ANOVA followed by Sidak post hoc test was used to assess the differences in the number of ghrelin cells, and unpaired Student’s t-test was used to assess differences in the number of CaSR cells. *** p < 0.001.

