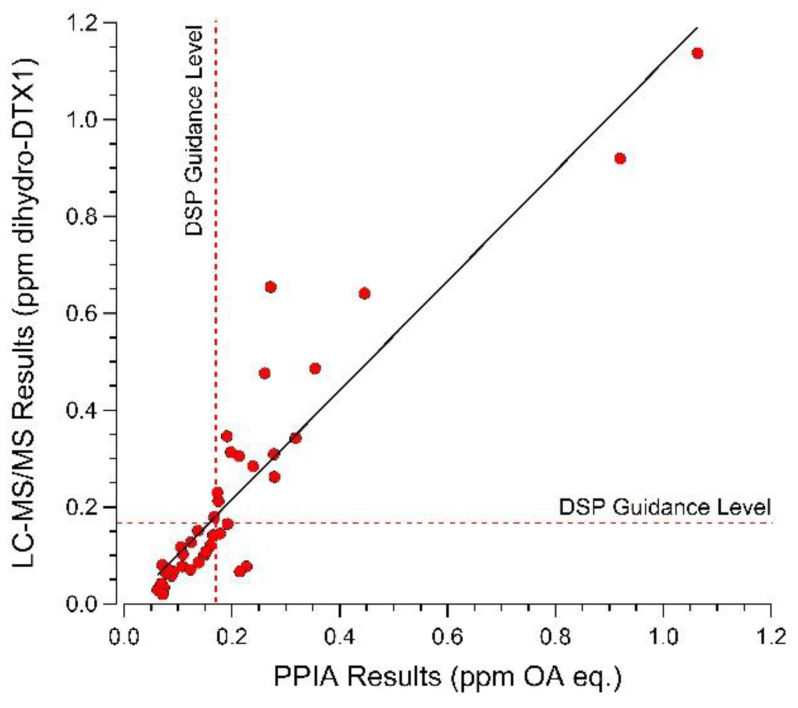
Figure 6.
Comparison of protein phosphatase inhibition, as measured using a commercial PPIA kit, and dihydro-DTX1 concentration, as measured by LC-MS/MS SRM analysis, for mussels (Mytilus edulis), oysters (Crassostrea virginica), and clams (Spisula solidissima, and Mya arenaria) (N = 42 total) collected in 2016 and 2018 from the central coast of the Gulf of Maine during blooms of Dinophysis norvegica. Dashed line indicates DSP guidance level of 0.16 ppm OA eq. Solid line indicates best fit linear regression for the two data sets (slope 1.13 ± 0.07, r2 0.86).

