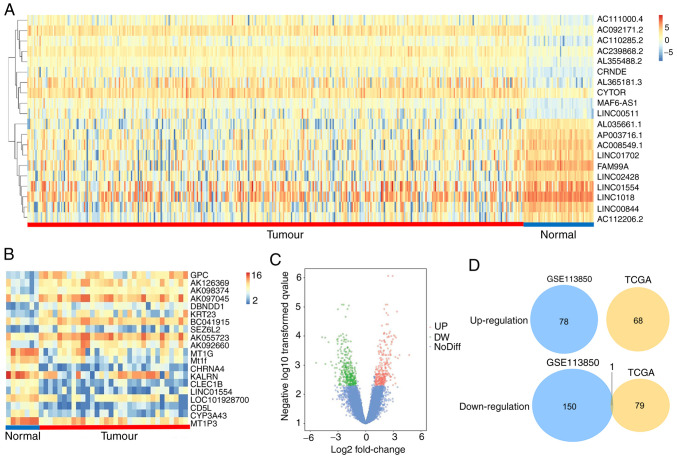
Figure 1.
(A) Hierarchical clustering analysis of the top 10 differentially expressed lncRNAs (|logFC| >1, P<0.05) from TCGA datasets. (B) Hierarchical clustering analysis of the top 10 differentially expressed genes (DEGs, |logFC| >2, P<0.05) from the GSE113850 dataset. (C) After analysing the GSE113850 dataset, we identified 229 DEGs, of which 151 were downregulated and 229 were upregulated, as indicated in a volcano plot (|logFC| >2; P<0.05). Red indicates upregulated DEGs; green indicates downregulated DEGs; blue indicates no difference. (D) Venn plot shows that LINC01554 is a common differentially expressed lncRNA in the GSE113850 and TCGA datasets. TCGA, Cancer Genome Atlas.

