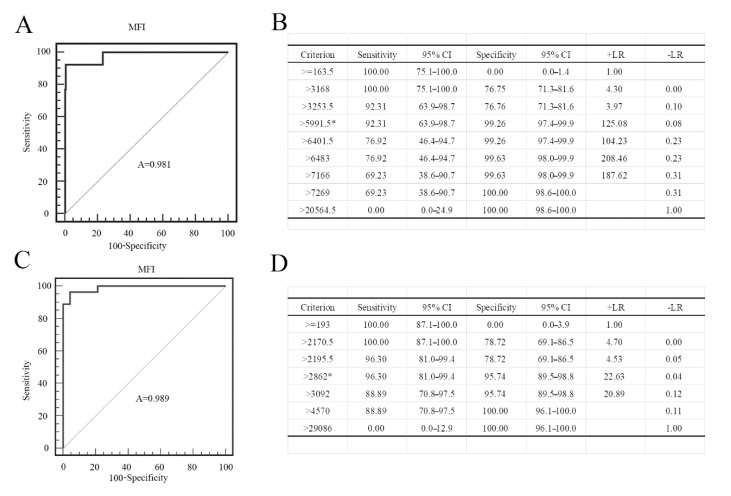
Figure 9.
Statistical analysis of the PRV gE and gB FMIA results. Reactivity of the PRV gE sera according to (A) the receiver operating characteristic (ROC) curve analysis with (B) the criterion value (MFI > 5991.5 is positive and MFI < 5991.5 is negative) of the assay (5991.5) denoted by *. Reactivity of the PRV gB sera according to (C) the ROC curve analysis with (D) the criterion value of the assay (2862) denoted by *. We used the SigmaPlot 10.0 for the analysis of the sensitivity and specificity of the assay. +LR is positive likelihood ratio; −LR is negative likelihood ratio.

