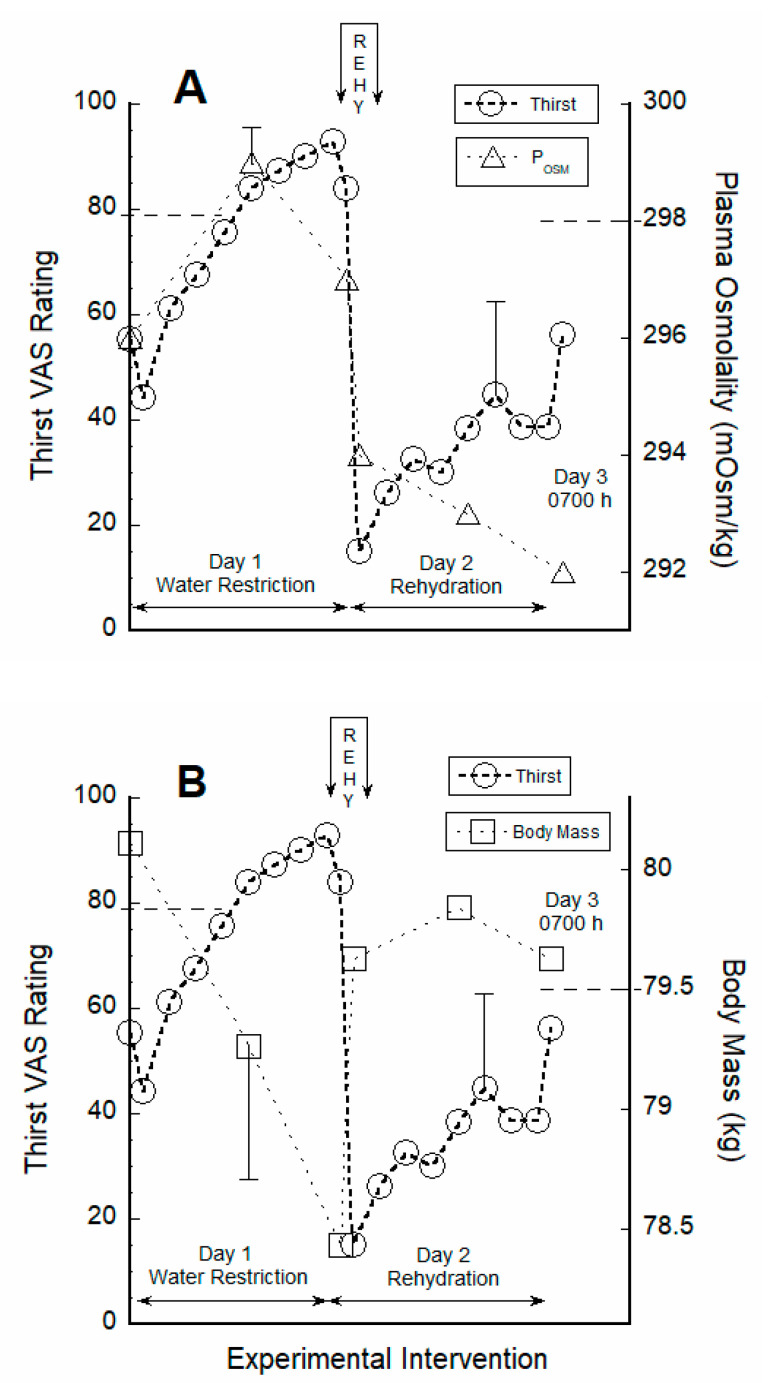
Figure 3.
Relationships between visual analogue scale (VAS) ratings of thirst and plasma osmolality (POSM; panel A) and between thirst and body mass (panel B). The dual y-axes are scaled to span the approximate minimum and maximum values of each variable. The dissociation of plasma osmolality and thirst appeared only on Table 3. (lower right quadrant of panel A). The re-emergence of euhydration is represented by body mass values on Day 3 (upper right quadrant of panel B) that are statistically similar to baseline (initial value on Day 1). The horizontal dashed lines that intersect each axis represent the group mean values measured during the thirst awareness visit to the laboratory on Day 1.

