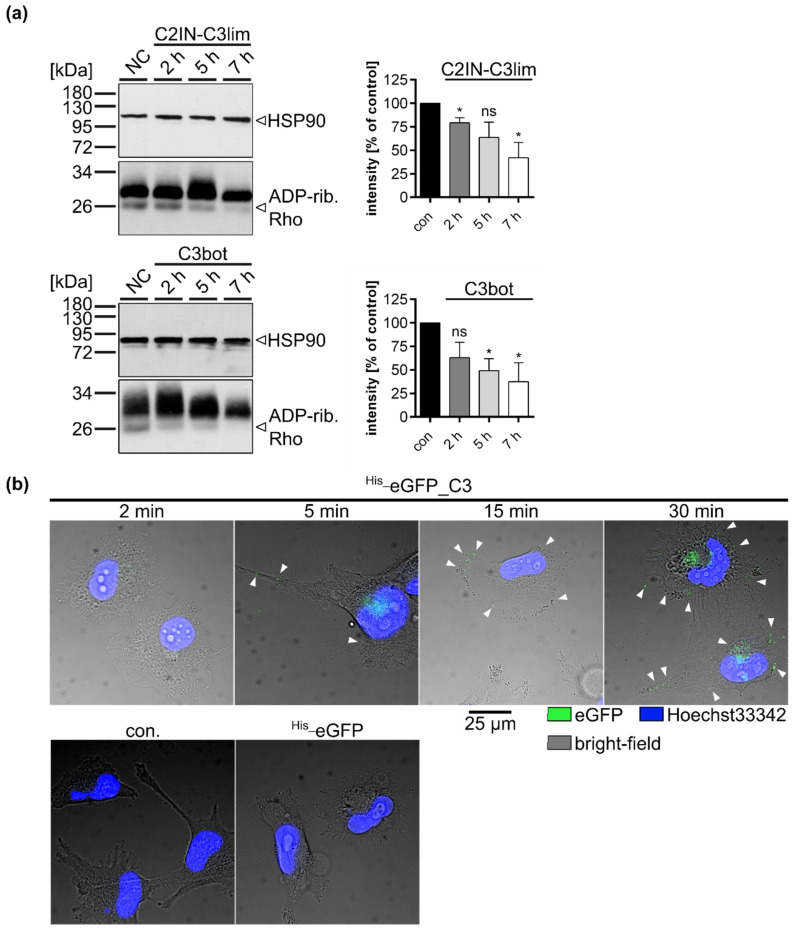
Figure 3.
C3 toxins enter U-DCS cells in a time-dependent manner. (a) U-DCS cells were treated with C2IN-C3lim (80 nM), C3bot (200 nM) or were left untreated (con) at 37 °C. After 2, 5, or 7 h incubation time, cells were washed twice with PBS, lysed, and incubated with freshly added C3bot (15 pmol) and biotin-NAD+ (10 µM) for 30 min at 37 °C. Afterwards, lysates were transferred to SDS-PAGE and Western blot analyses to visualize biotin-labeled, i.e., ADP-ribosylated Rho proteins via peroxidase-coupled streptavidin (lower panels, ~21 kDa). Equal protein loading was confirmed via HSP90-immunostaining (upper panels, ~90 kDa). Densitometrical analyses from several experiments (normalized to HSP90 loading control) are given as mean ± SD (n = 3). Significance was tested using a Student’s t test (ns = not significant, * p < 0.05). (b) U-DCS cells were treated with His_eGFP_C3bot (250 nM) for 2, 5, 15, 30 min, for 30 min with His_eGFP, or were left untreated (con). Subsequently, the cells were washed twice with PBS and fixed with PFA. After nucleus staining with Hoechst33342 (blue) images were taken with an epifluorescence microscope. The three channels for Heechst33342 at 390 nm excitation blue, for eGFP at 488 nm excitation, and the bright-field (for cell borders) were merged. Scale bar corresponds to 25 µm and holds for all images. For better visualization, green eGFP-signals were marked with white arrow heads.

