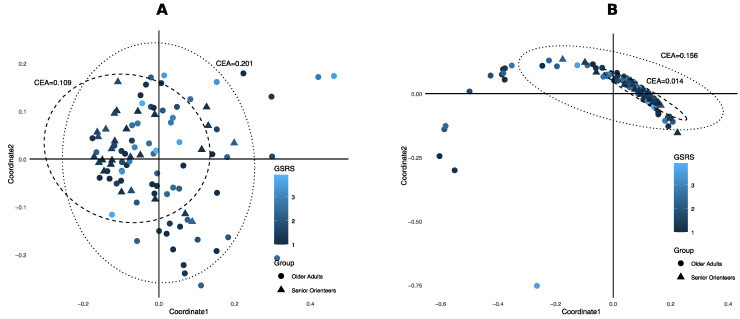
Figure 7.
Principal coordinates analysis (PCoA) plots. Principal coordinates were estimated using Bray–Curtis distance on the predicted species. Each dot represents an individual sample, shape depicts groups, and blue scale codes for the gastrointestinal symptom scores measured with Gastrointestinal Symptom Rating Scale (GSRS) values. Dotted ellipse indicates 95% confidence region of older adults and dashed ellipse indicates 95% confidence region of senior orienteers. CEA = 95% confidence ellipse area. (A) PCoA using all predicted species; (B) PCoA using four selected species that were significantly different between older adults and senior orienteers.

