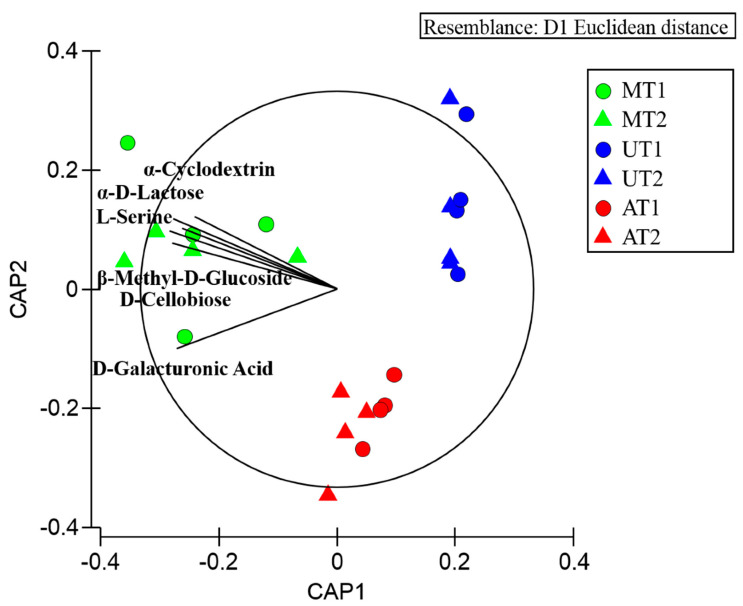
Figure 2.
Canonical analysis of principal coordinates (CAP) plot showing the metabolic utilization of 31 different carbon sources by the microbial community associated with mucus (M), umbrella (U), and oral arms (A) and of R. pulmo in July (T1) and February (T2). Vectors are proportional to the Pearson correlation of the carbon source variables.

