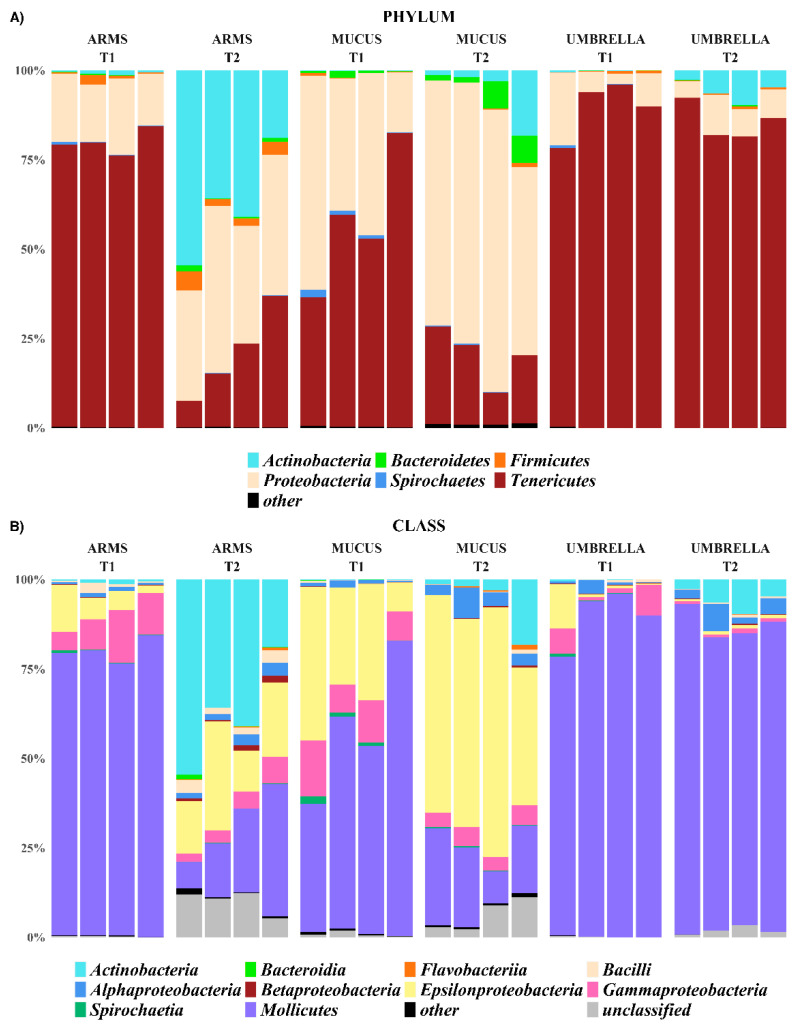
Figure 3.
Stacked bar-plot of the relative abundances at phylum (A), and class (B) level of all the arms, mucus, and umbrella samples at the T1 (July 2016) and T2 (February 2017) sampling times. In particular, only the taxa with a relative abundance equal or higher than 1% were plotted, otherwise were collapsed into “Other”.

