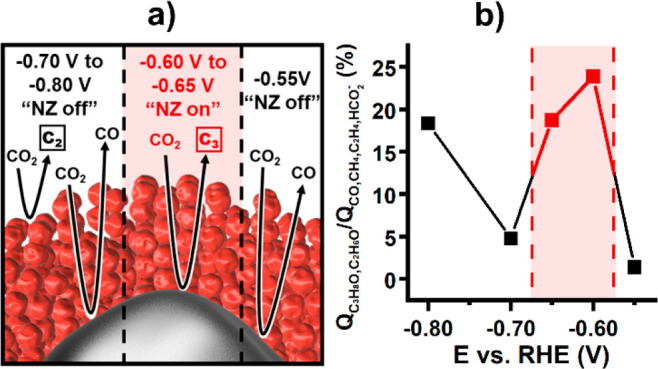
Figure 3.

(a) Schematic representation of processes occurring at the specific potential windows with active (red) or inactive (black) nanozyme cascade mechanism. (b) Preference for the formation of C2 and C3 products over other carbon-containing products as charge ratio. Nanozyme activity window is marked in red.
