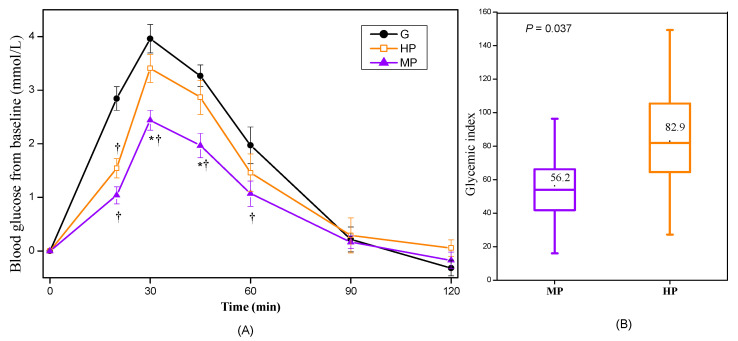
Figure 2.
Glycemic responses of cooked potato samples (n = 17). G, glucose; HP, highly cooked potato; MP, minimally cooked potato. (A) Blood glucose changes from baseline for potato samples. (B) The GI values of potato samples. Values are shown as the mean value with their standard errors represented by vertical bars. * HP different from MP, † HP, or MP different from G (p < 0.05).

