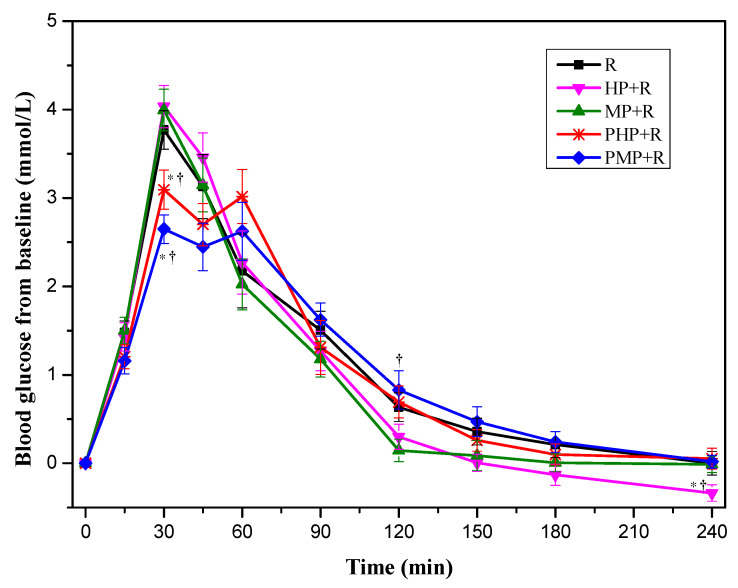
Figure 3.
Blood glucose changes from baseline for mixed test foods (n = 17). R, rice; HP, highly cooked potatoes; MP, minimally cooked potatoes. HP + R, co-ingestion of HP and rice; MP + R, co-ingestion of MP and rice; PHP + R, preload HP with rice; PMP + R, preload MP with rice. Values are shown as the mean value with their standard errors represented by vertical bars. * Test meals different from rice, † preload different from co-ingestion test meals (p < 0.05).

