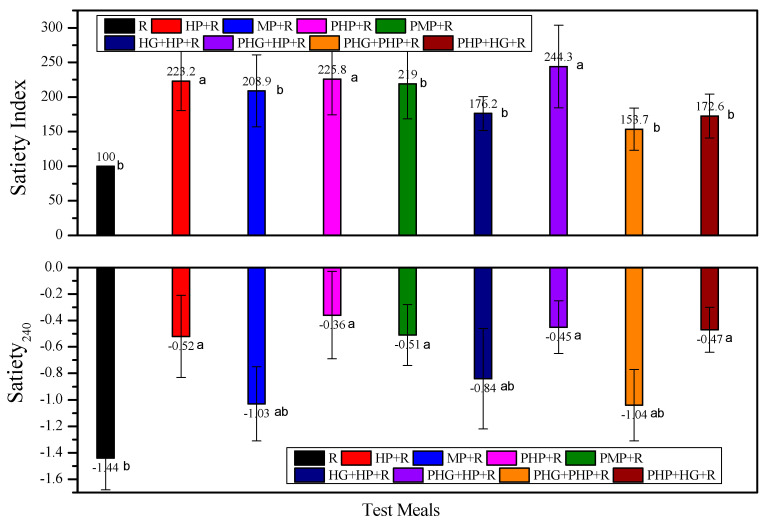
Figure 5.
Satiety index and satiety at 240 min for test foods. R, rice; HP, highly cooked potato; PHP, preload highly cooked potato; MP, minimally cooked potato; PMP, preload minimally cooked potato; HP + R, co-ingestion of HP and rice; MP + R, co-ingestion of MP and rice; PHP + R, preload HP prior to rice meal; PMP + R, preload MP prior to rice meal; HG, partially hydrolyzed guar gum; PHG, preload HG; HG + HP + R, co-ingestion of HG, HP and rice; PHG + HP + R, preload HG prior to co-ingestion of HP and rice; PHG + PHP + R, co-preload of HG and HP prior to rice meal; PHP + HG + R, preload of HP prior to co-ingestion of HG and rice. Values are shown as the mean value with their standard errors represented by vertical bars. Data were analyzed by one-way (treatment) ANOVA with Duncan’s multiple range test, significant differences (p < 0.05) were represented by different letters and values are shown as the mean value with their standard errors represented by vertical bars.

