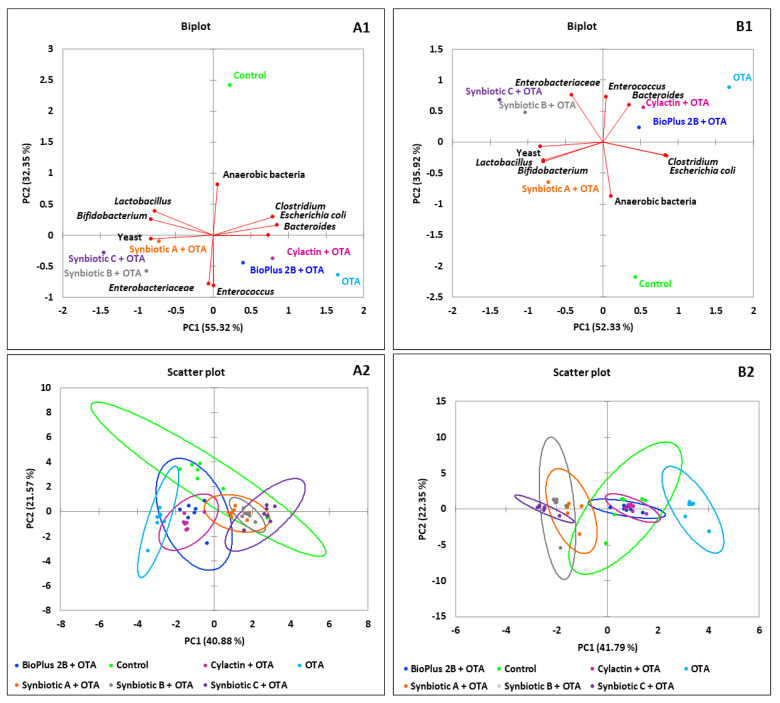
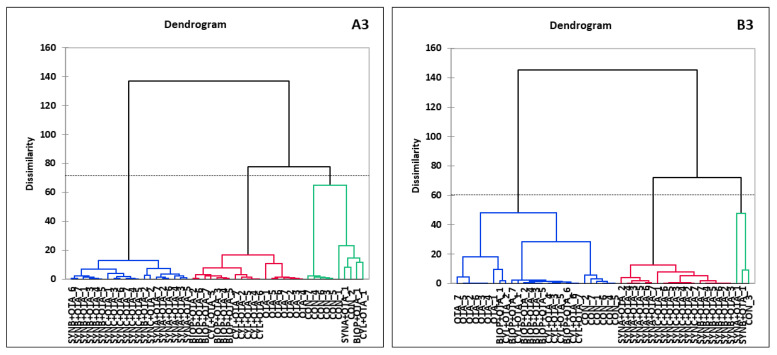
Figure 1.
PCA plot of counts of microorganisms that dominate in the jejunum of turkeys. The scatter plot showing a clustering of individuals in groups of animals. AHC of 42 birds by the Ward’s method. The dotted line on the dendrogram is located at the node before the largest relative increase in dissimilarity level, (A1–A3) after 6 and (B1–B3) after 15 weeks of animals rearing.


