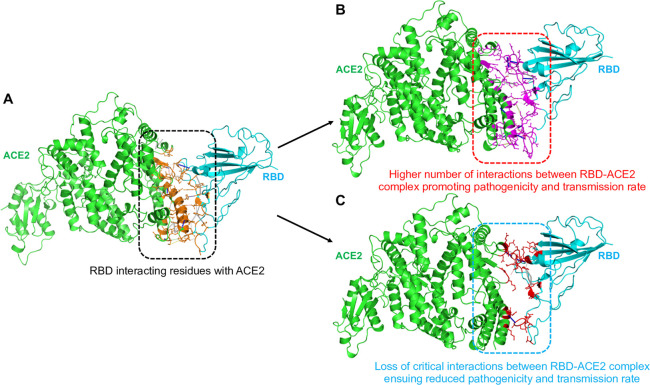
Figure 1.
Structures and interactions in RBD–ACE2 complexes. (A) Ribbon structure of SARS-CoV-2 RBD in complex with human ACE2 (Protein Data Bank (PDB): 6LZG), showing the residues of S-protein RBD interacting with ACE2 receptor. The residues interacting between RBD–ACE2 are represented in orange sticks. Intermolecular interactions in (B) an affinity-increasing and (C) an affinity-decreasing RBD–ACE2 complex. In all the panels, the RBD and ACE2 are shown in cyan and green color, respectively. The interacting residues and binding sites in panel B are shown in purple sticks, and in panel C are shown in red sticks.

