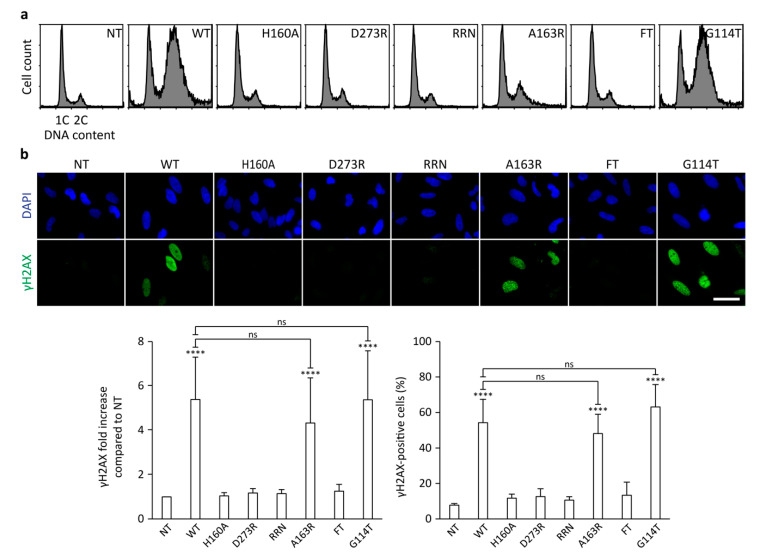
Figure 5.
Effect of mutations on CdtB-induced cytotoxicity and DNA damage. (a) Representative cell cycle analysis of HeLa cells transfected with 1 ng/mL of HducCdtB mutants for 36 h. (b) Representative images of γH2AX immunofluorescence and associated γH2AX quantifications from HeLa cells transfected with 1 µg/mL of HducCdtB mutants for 24 h. Quantifications of γH2AX signal are represented as the mean fluorescence intensity per cell (normalized to 1 for the untreated condition) or as the proportion of γH2AX-positive cells. Results present the mean ± SD of at least three independent experiments. Statistical differences were analyzed between each CDT treatment and the untreated condition (****, p-value < 0.0001) and between CDT mutants and the WT CDT (ns, p-value > 0.05). NT: Untreated cells. Scale bar: 50 µm.

