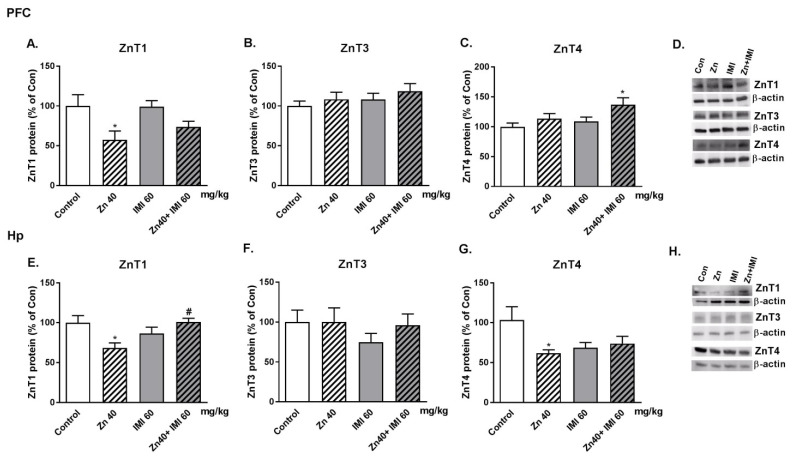
Figure 7.
Western blot analysis of the effect of Zn (40 mg Zn/kg) + IMI (60 mg/kg), and NaCl (control) administered p.o. on the protein levels of Zn transporters: (A,E) ZnT1, (B,F) ZnT3, and (C,G) ZnT4 in the PFC and Hp of mouse brain. Representative western blots (D,H). Results are expressed as mean ± S.E.M (n = 5–6 per group). * p < 0.05 vs. control group, # p < 0.05 vs. Zn group (two-way ANOVA followed by Tukey post-hoc test).

