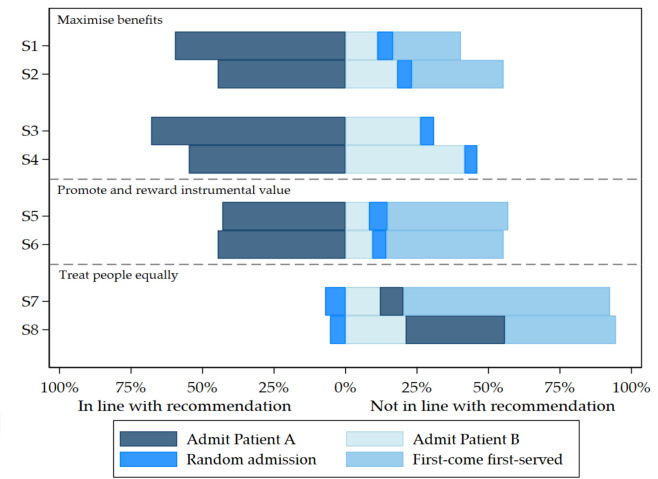
Figure 1.
Survey responses. Each bar represents the distribution of answers for each of the eight scenarios. The bars on the left-hand side represent the share of answers in line with the recommendations from the guidelines. The bars on the right-hand side represent the share of answers not in line with the recommendations.

